
Articles
Price Action With Fibonacci: Combining Price Action and Fibonacci Levels
Combining price action with Fibonacci levels is simple but powerful. Here’s how to unleash the potential of these levels. Many traders, especially forex traders, keep an eye on support & resistance levels to place their buy & sell orders. But let’s see how to best use the Fibonacci retracement levels as potential support & resistance levels.
USING THE FIBONACCI TOOL
Fibonacci tools—I call them Fib tools—work well when a market is trending. But before making your entry & exit decisions using these tools, you need to find the retracement levels.
The first step is to find out the recent swing high and swing low. If a market is trending downward, you need to click your mouse on the swing high and drag the cursor to the recent swing low. For an uptrend, you click the swing low and drag the cursor to the recent swing high. The Fib retracement levels traders typically use as their support & resistance areas include 0.236, 0.382, 0.500, 0.618, and 0.764. In an uptrend you can buy at these levels and in a downtrend you can sell at these levels.
APPLYING FIBONACCI TOOLS TO PRICE ACTION
You can use Fib tools on their own but you can also combine them with other indicators or patterns. I will show you how to combine Fib tools with candlestick patterns. In part 1 of this article series , I discussed how reversal candlesticks can help you determine when buy-ing or selling pressure is exhausted. Since this strategy is based on when the market is trending, you can look out for exhaustive candlesticks that give you a clue as to when the trend is ending.
Take a look at the one-hour chart of GBP/NZD in Figure 1. It’s clearly in an uptrend. In an uptrend, the general thinking is that if the currency pair retraces from the recent high, it will find support at one of the Fib levels, where traders would want to place buy orders as the price pulls back. I set the swing low at 1.9859 on November 28, 2014 and the swing high at 2.0270 on December 3, 2014 and overlaid the Fib tool based on these points. You have to wait for the uptrend to retrace from the recent high before you initiate any buy orders or make any analysis on the Fib levels.
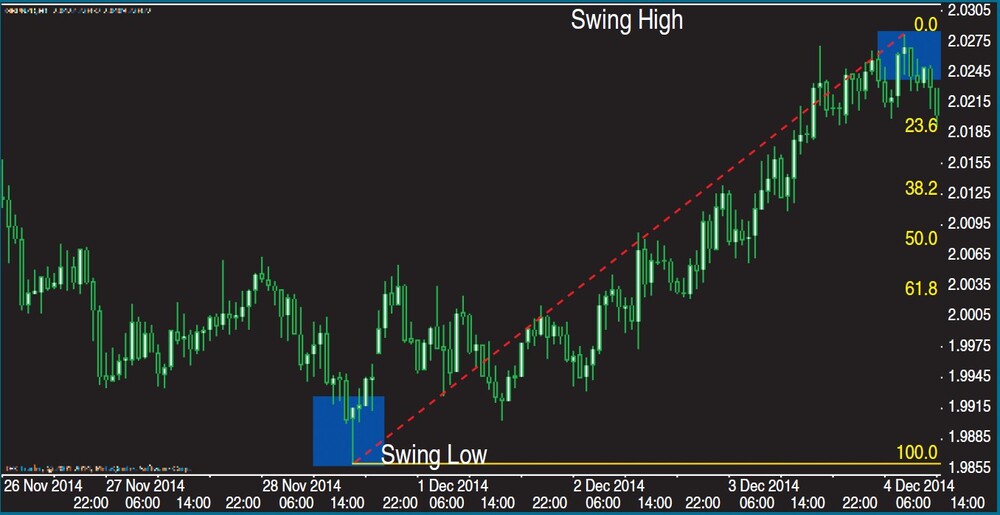
FIGURE 1: CURRENCY PAIR IN AN UPTREND. Here the swing low is set at 1.9859 on November 28, 2014 and the swing high at 2.0270 on December 3, 2014 and overlaid the Fib tool based on these points.
In Figure 2, you see that GBP/NZD commenced its upward movement on November 28, 2014, retraced on December 4, 2014, and converged at the 38.2 Fib level. The 38.2 Fib level held for two days before it continued its upward movement. It is best to take a long position after the appearance of a price rejection candlestick at the 38.2 Fib level. As the market oscillates over time, you have to look out for exhaustive bearish candlesticks peculiar to uptrending markets; that would determine how long the market would last. As you can see, the market has traveled above the recent high, which resulted in the formation of a shooting star price rejection candlestick. You can close your order after the appearance of price rejection candlesticks, which will give you about 355 pips profits.
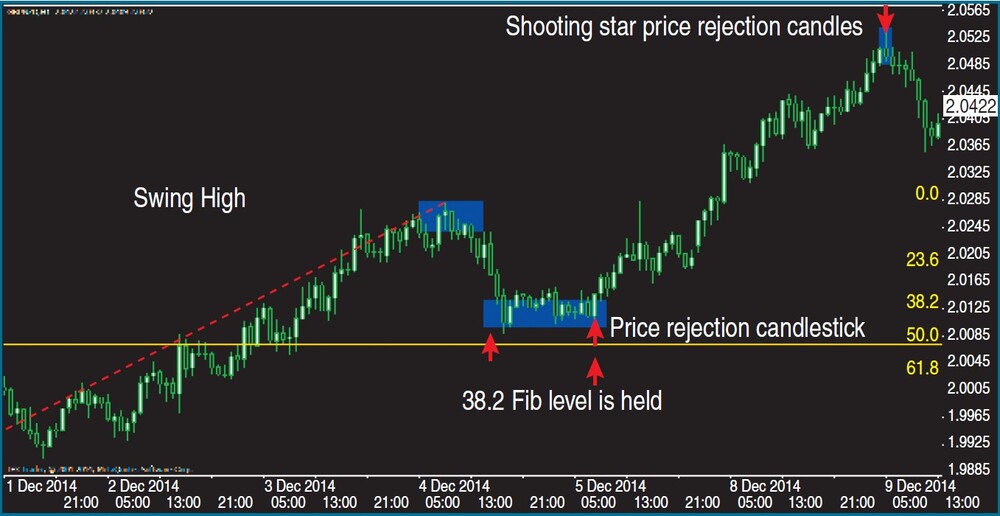
FIGURE 2: THE END OF THE UPTREND. It’s best to wait for the uptrend to retrace from the recent high before you initiate any buy orders. Then as the market moves up you have to look for signs of price rejection which will signal you to exit your position.
Let’s examine a similar situation in a down-trend. In Figure 3, you will find a one-hour chart of EUR/USD in a downtrend. I set the swing high at 1.2529 on November 26, 2014 and the swing low at 1.2300 on December 3, 2014 and overlaid the Fib tool on the chart. In a down-trend, it is expected that if prices retrace from the low, it will encounter resistance at one of the Fib retracement levels, which will give traders the opportunity to short. Since the EUR/USD currency pair was stalling at 1.2310 along the low, it was time to put the Fib tool in action. I will wait for price to push upward and retrace to enable me to take a short position.
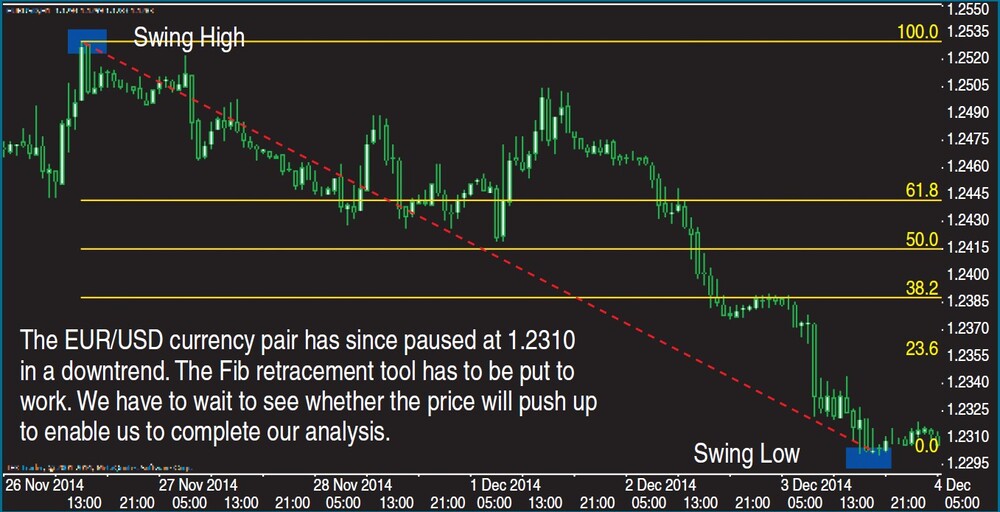
FIGURE 3: PRICE ACTION IN A DOWNTREND. On this one-hour chart of EUR/USD, price action is in a clear downtrend. The Fib tool is overlaid on this chart based on the swing high at 1.2529 on November 26, 2014 and swing low at 1.2300 on December 3, 2014. You want to wait for price to push upward and retrace before taking a short position.
However, in Figure 4, you see that on December 4, 2014 the price pushes up to about 1.2445 from 1.2310 resulting in the formation of an exhaustive candlestick pattern called a shooting star. The principle behind price action is that if an exhaustive candlestick forms above or below a Fib retracement level, it gives you a confirmation that the level will hold for some time.
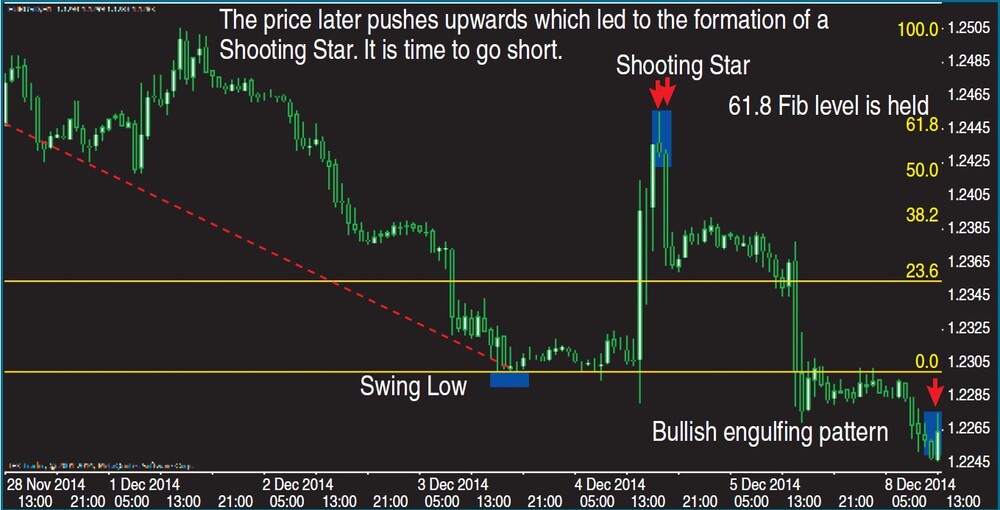
FIGURE 4: THE RETRACEMENT. Price pushes up to about 1.2445 from 1.2310 resulting in the formation of an exhaustive candlestick called a shooting star. Since the shooting star formed at the 61.8 Fib level, it suggests that you can go short after the shooting star formed. You could hold on to the short position until the bullish engulfing pattern appeared at the end of the downtrend.
The exhaustive candlestick pattern did form at the 61.8 Fib retracement level. This means you have to go short after the shooting star formed. How long will you keep the short trades open? You have to look out for exhaustive candlestick patterns. On this chart, you will see that there is another exhaustive candlestick pattern called a bullish engulfing pattern that appears at the end of the downtrend. You can exit the short trade that you opened when that price rejection candlestick pattern appears. If you covered your short position here, you would have made a profit of 200 pips.
Mastering Trading With Price Action Books

USING FIB TOOLS TO MANAGE YOUR TRADES
Basically, there are two ways to set your stop-loss with Fib tools. But it is better to combine the Fib tool with your knowledge of price rejection (exhaustive) candlesticks to set your stop-loss.
The first step of the first method is to set your stop-loss past the next Fib level. In the one-hour chart of EURUSD in Figure 5, if you shorted at the 50.0 Fib level, you place your stop-loss at the next Fib level of 61.8. You do this based on the understanding that the 50.00 Fib level will hold. Another way to guide against placing a premature stop-loss is to combine your analysis with price rejection candlesticks. In the chart in Figure 5 you see a shooting star price rejection candlestick. When an exhaustive candlestick forms above or below the Fib retracement level, it means that that level could hold. Managing stop-losses this way is suitable for short-term intraday traders.
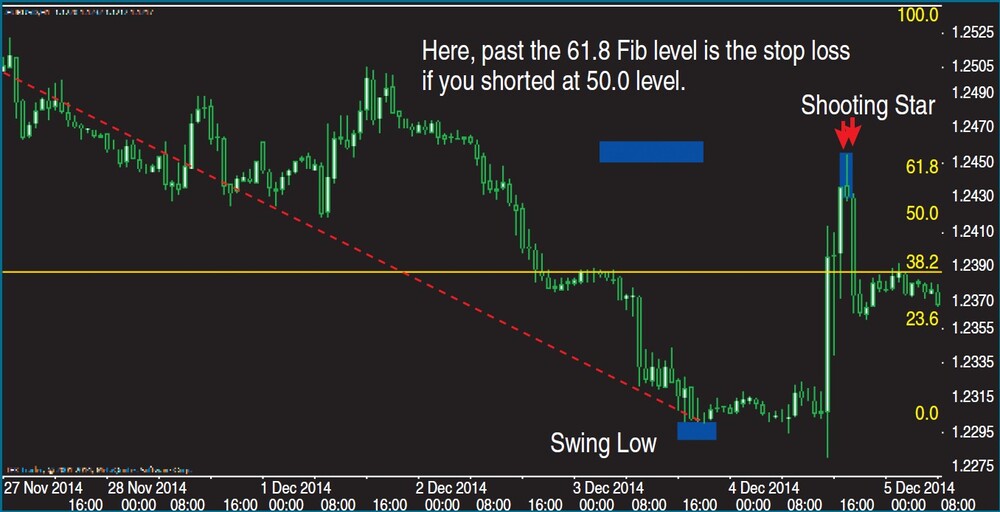
FIGURE 5: MANAGING YOUR RISKS WITH FIB TOOLS IN A DOWNTREND. One method is to set your stop loss past the next Fib level. If you shorted at the 50.0 Fib level, you would place your stop loss at the next Fib level of 61.8.
The second method of setting your stop-loss is to place it past the swing high or swing low. In Figure 6 you see that if you had shorted the EURUSD at the 50.00 Fib level, you could place your stop-loss above the swing high as high-lighted on the chart. Adopting this method does have consequences that you need to be aware of. It’ll result in having a wider stop-loss, which could be unsuitable for long-term, swing, and position traders. If you adopt this method, you need to adjust your position size accordingly because of the cost implication. You may have an unfavorable reward-to-risk ratio as a result of the wide stop-loss if it is not proportional to your potential reward. The advantage of this method is that it gives your trades more room to remain in the market until the market moves in your favor.
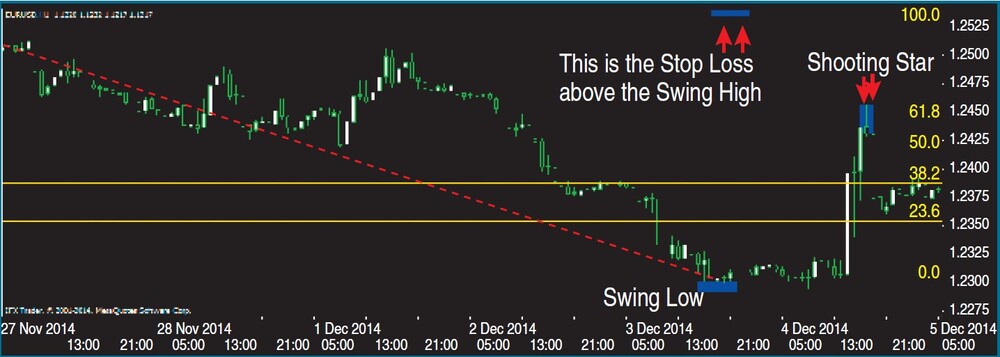
FIGURE 6: PLACE THE STOP PAST THE SWING HIGH OR LOW. If you had shorted the EURUSD at the 50.00 Fib level, you could place your stop loss above the swing high as highlighted on the chart. However, be mindful that your stop loss will be wide which could be unsuitable for long term, swing and position traders.
CANDLES AND FIBS
Combining Fib tools with candlestick patterns can be useful in making your trading decisions. An exhaustive candlestick pattern signals whether a Fib retracement level is likely to hold. The Fib tool used in isolation does not have a high success rate but works well when combined with other technical tools like price action. You use the Fib tool to spot potential support & resistance levels, then look back to see whether these levels are in line with other previous price areas. If they are, there is a likelihood that prices will bounce from these levels.