Articles
Trendline Basics

The trend of prices is the feature that is most sought after in technical analysis, yet surprisingly simple constructs can get you right with the market. Here, veteran trader and analyst Martin Pring takes you through the basics of creating and interpreting trendlines. Trendlines are a simple but highly effective tool. In technical analysis, we assume prices move in trends, and that once begun, a trend continues. Therefore, you, as a technician, must be concerned with identifying a price reversal at an early stage and riding it until the evidence proves the trend has once again turned. Trendlines represent one of these items of evidence.
Trendlines are not perfect tools, but then, what technical indicators are? In my experience, however, they can be highly effective. If I had to be cast off on a deserted island with only two or three technical indicators, I would not hesitate to take trendlines along.
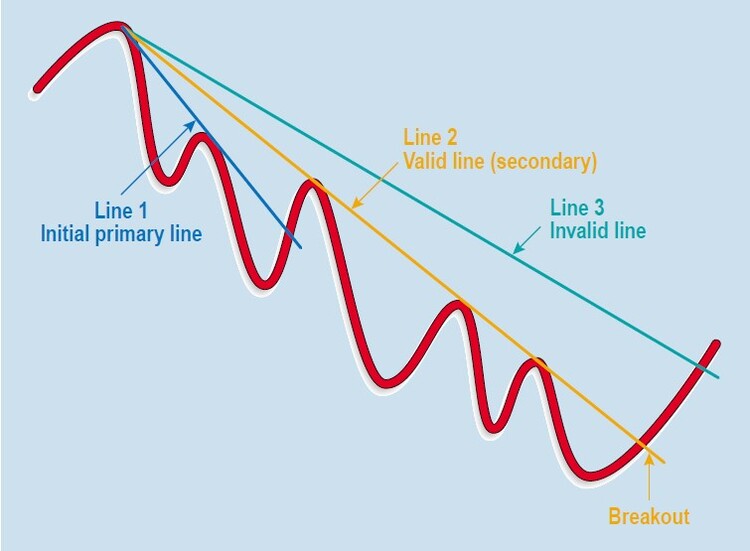
FIGURE 1: DOWN TRENDLINE
A down trendline is constructed by joining a series of declining peaks. A buy signal is triggered when the down trendline is violated. It is normal to begin with the first or highest peak, then connecting the line to the second as in line 1. This is known as a primary trendline. Never draw a line that does not touch any of the peaks such as the trendline drawn in line 3, because it is merely a line drawn in space with no forecasting significance whatsoever. On the other hand, it is permissible to ignore the highest peak and connect some of the others. An example can be seen in line 2. This is known as a secondary trendline. Secondary trendlines are perfectly valid because they offer a good rendition of the underlying trend. A trendline of this nature is far better in this instance than the dashed line drawn from the peak, which was too steep to be sustained.
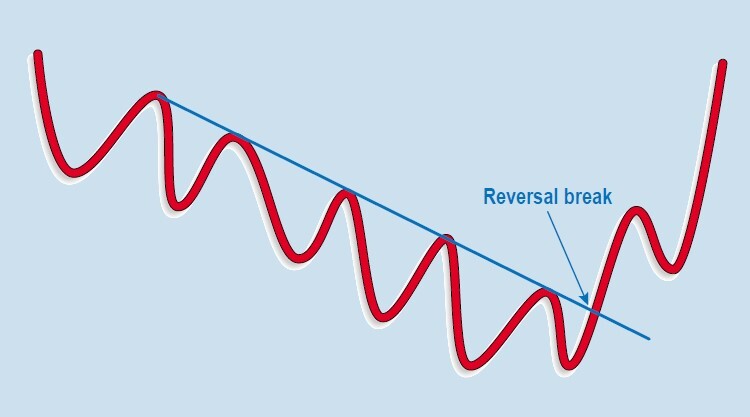
FIGURE 2: REVERSAL BREAK
Most people think that when a trendline is violated, the prevailing trend is reversed (Figure 2). That’s not strictly true. Barring whipsaws, when a trendline is violated, the trend changes. In the case of an up trendline, the violation may change from up to down — in fact, a reversal. Alternatively, the price may experience a trading range —that is, from up to sideways. It either resumes the uptrend, albeit at a slower pace (Figure 3) — known as a consolidation break — or it may break to the downside, in which case the initial trendline break may still be associated with a reversal.
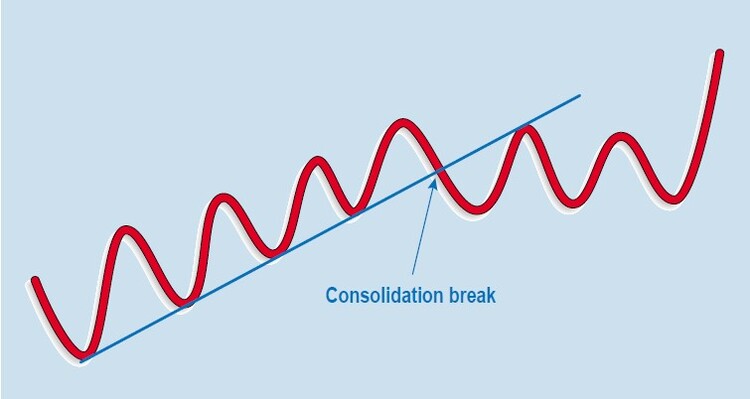
FIGURE 3: CONSOLIDATION BREAK
IS IT A BREAK (FIGURE 3)? Another idea is to monitor your favorite momentum indicator. Chances are that if it has experienced several divergences with the price, a reversal is more likely to follow. This is because the oscillator is pointing out subsurface strength or weakness in the market. Finally, if the trend break develops contrary to the primary trend, this is also more likely to be followed by a reversal than a consolidation. For instance, if an uptrend joining a series of rising bottoms in a bear market rally is violated, expect the penetration of the trendline to be followed by resumption of the bear market. The reverse is also true, for the violation of a trendline joining declining peaks during a bull market reaction.
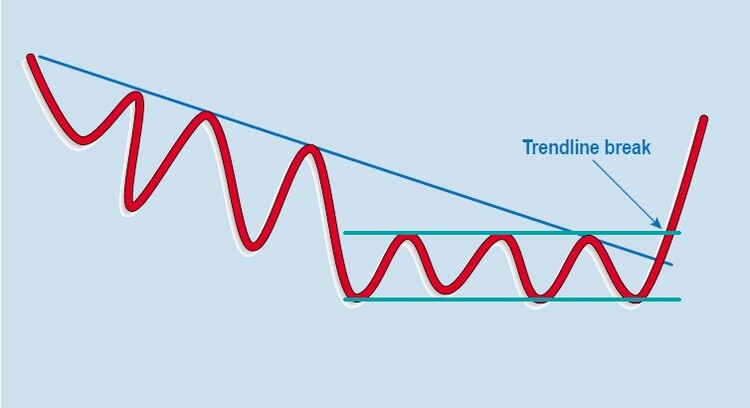
FIGURE 4: SPOT THE REVERSAL BREAK
If a violation develops about the same time that the price is breaking out from a trading range (Figure 4), this is more likely to be a reversal break since we have two pieces of evidence for a possible trend reversal.
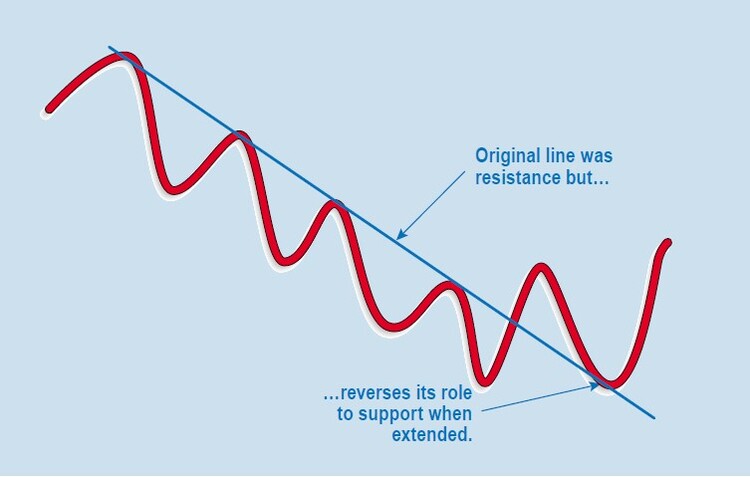
FIGURE 5: SUPPORT TURNS TO RESISTANCE
Once a trendline has been penetrated, most of us tend to forget about the line, concentrating instead on those elusive profits. It’s a rule of trendline analysis, though, that once a trendline has been violated, it reverses its support/resistance role. Thus, an up trendline that had been a dynamic level of support reverses its role to resistance in its postviolation existence. Similarly, the down trendline becomes support once it has been penetrated. Figure 5 shows an example of each situation.
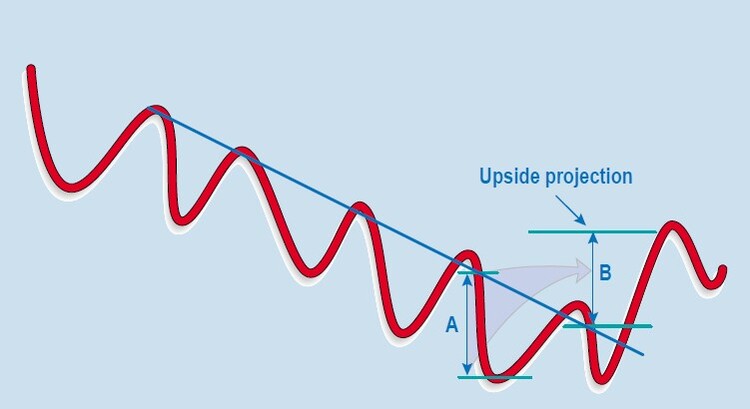
FIGURE 6: PROJECT THE NEXT MOVE
It’s also possible to project price moves following trendline violations. This can be achieved by measuring the maximum distance between the line and the price. In the case of a down trendline (Figure 6), this is projected upward. Such projections do not always materialize, of course, but they do give us a rough idea of where prices might be headed.
THREE RULES OF SIGNIFICANCE
1. Not all trendlines are created equal, and there are three rules for determining their significance. The first states that the sharper the angle of ascent or descent, the less sustainable the trend is, and therefore, the less significant the line.
2. This rule involves the length of the line; all other things being equal, the longer the trendline, the greater the significance of the penetration. When you consider, this is fairly self-evident because the trendline should reflect the underlying trend. If the line is long, extending back a number of years, it reflects an extensive trend. Its penetration should therefore have implications far greater than, say, the violation of a three-week line.
3. The third rule states that the more a trendline has been touched or approached, the greater its significance. To appreciate this point, remember a trendline should reflect the underlying trend. If it has turned back numerous rallies and reactions, this means that the line is really a dynamic level of support or resistance. In that case, its violation is akin to the penetration of a major support or resistance level.


