Book Review

Trading Price Action Reversals: Technical Analysis of Price Charts Bar By Bar for the Serious Trader

Trading Price Action Reversals By Al Brooks Cover

A detailed guide to profiting from trend reversals using the technical analysis of price action.

Page by page, Brooks skillfully addresses how to spot and profit from trend reversals which offer an excellent risk-reward ratio using the technical analysis of price action. Along the way, he touches on some of the most essential aspects of this approach as well as several other important topics, including the various types of reversals, successfully trading the opening range of a day session, price action setups that new traders should focus on, and much more. Throughout the book, Brooks focuses primarily on 5 minute candle charts all of which are created with TradeStation to illustrate basic principles, but also discusses daily and weekly charts. And since he trades more than just E-mini S&P 500 futures, Brooks also details how price action can be used as the basis for trading stocks, forex, Treasury Note futures, and options.

SIGNS OF STRENGTH: TRENDS, BREAKOUTS, REVERSAL BARS, AND REVERSALS:

Here are some characteristics that are commonly found in strong trends:

  • There is a big gap opening on the day.
  • There are trending highs and lows (swings).
  • Most of the bars are trend bars in the direction of the trend.
  • There is very little overlap of the bodies of consecutive bars. For example, in a bull spike, many bars have lows that are at or just one tick below the closes of the prior bar. Some bars have lows that are at and not below the close of the prior bar, so traders trying to buy on a limit order at the close of the prior bar do not get their orders filled and they have to buy higher.
  • There are bars with no tails or small tails in either direction, indicating urgency. For example, in a bull trend, if a bull trend bar opens on its low tick and trends up, traders were eager to buy it as soon as the prior bar closed. If it closes on or near its high tick, traders continued their strong buying in anticipation of new buyers entering right after the bar closes. They were willing to buy going into the close because they were afraid that if they waited for the bar to close, they might have to buy a tick or two higher.
  • Occasionally, there are gaps between the bodies (for example, the open of a bar might be above the close of the prior bar in a bull trend).
    A breakout gap appears in the form of a strong trend bar at the start of the trend.
  • Measuring gaps occur where the breakout test does not overlap the breakout point. For example, the pullback from a bull breakout does not drop below the high of the bar where the breakout occurred.
  • Micro measuring gaps appear where there is a strong trend bar and a gap between the bar before it and the bar after it. For example, if the low of the bar after a strong bull trend bar in a bull trend is at or above the high of the bar before the trend bar, this is a gap and a breakout test and a sign of strength.
  • No big climaxes appear.
  • Not many large bars appear (not even large trend bars). Often, the largest trend bars are countertrend, trapping traders into looking for countertrend trades and missing with-trend trades. The countertrend setups almost always look better than the with-trend setups.
  • No significant trend channel line overshoots occur, and the minor ones result in only sideways corrections.
  • There are sideways corrections after trend line breaks.
  • Failed wedges and other failed reversals occur.
  • There is a sequence of 20 moving average gap bars (20 or more consecutive bars that do not touch the moving average, discussed in book 2).
    Few if any profitable countertrend trades are found.
  • There are small, infrequent, and mostly sideways pullbacks. For example, if the Emini’s average range is 12 points, the pullbacks will all likely be less than three or four points, and the market will often go for five or more bars without a pullback.
  • There is a sense of urgency. You find yourself waiting through countless bars for a good with-trend pullback and one never comes, yet the market slowly continues to trend.
  • The pullbacks have strong setups. For example, the high 1 and high 2 pullbacks in a bull trend have strong bull reversal bars for signal bars.
  • In the strongest trends, the pullbacks usually have weak signal bars, making many traders not take them, and forcing traders to chase the market. For example, in a bear trend the signal bars for a low 2 short are often small bull bars in two or three bar bull spikes, and some of the entry bars are outside down bars. It has trending “anything”: closes, highs, lows, or bodies.
  • Repeated two-legged pullbacks are setting up with trend entries.
  • No two consecutive trend bar closes occur on the opposite side of the moving average.
  • The trend goes very far and breaks several resistance levels, like the moving average, prior swing highs, and trend lines, and each by many ticks.
  • Reversal attempts in the form of spikes against the trend have no follow-through, fail, and become flags in the direction of the trend.

The more of the following characteristics that a bull breakout has, the more likely the breakout will be strong:

  • The breakout bar has a large bull trend body and small tails or no tails. The larger the bar, the more likely the breakout will succeed.
  • If the volume of the large breakout bar is 10 to 20 times the average volume of recent bars, the chance of follow-through buying and a possible measured move increases.
  • The spike goes very far, lasts several bars, and breaks several resistance levels, like the moving average, prior swing highs, and trend lines, and each by many ticks.
  • As the first bar of the breakout bar is forming, it spends most of its time near its high and the pullbacks are small (less than a quarter of the height of the growing bar).
  • There is a sense of urgency. You feel like you have to buy but you want a pull-back, yet it never comes.
  • The next two or three bars also have bull bodies that are at least the average size of the recent bull and bear bodies. Even if the bodies are rela-tively small and the tails are prominent, if the follow-through bar (the bar after the initial breakout bar) is large, the odds of the trend continuing are greater.
  • The spike grows to five to 10 bars without pulling back for more than a bar or so.
  • One or more bars in the spike have a low that is at or just one tick below the close of the prior bar.
  • One or more bars in the spike have an open that is above the close of the prior bar.
  • One or more bars in the spike have a close on the bar’s high or just one tick below its high.
  • The low of the bar after a bull trend bar is at or above the high of the bar before the bull trend bar, creating a micro gap, which is a sign of strength. These gaps sometimes become measuring gaps. Although it is not significant to trading, according to Elliott Wave Theory they probably represent the space between a smaller time frame Elliott Wave 1 high and a Wave 4 pullback, which can touch but not overlap.
  • The overall context makes a breakout likely, like the resumption of a trend after a pullback, or a higher low or lower low test of the bear low after a strong break above the bear trend line.
  • The market has had several strong bull trend days recently.
  • There is growing buying pressure in the trading range, represented by many large bull trend bars, and the bull trend bars are clearly more prominent than the bear trend bars in the range.
  • The first pullback occurs only after three or more bars of breaking out.
  • The first pullback lasts only one or two bars, and it follows a bar that is not a strong bear reversal bar.
  • The first pullback does not reach the breakout point and does not hit a breakeven stop (the entry price).
  • The breakout reverses many recent closes and highs. For example, when there is a bear channel and a large bull bar forms, this breakout bar has a high and close that are above the highs and closes of five or even 20 or more bars. A large number of bars reversed by the close of the bull bar is a stronger sign than a similar number of bars reversed by the high.

The more of the following characteristics that a bear breakout has, the more likely the breakout will be strong:

  • The breakout bar has a large bear trend body and small tails or no tails. The larger the bar, the more likely the breakout will succeed.
  • If the volume of the large breakout bar is 10 to 20 times the average volume of recent bars, the chance of follow-through selling and a possible measured move down increases.
  • The spike goes very far, lasts several bars, and breaks several support levels like the moving average, prior swing lows, and trend lines, and each by many ticks.
  • As the first bar of the breakout bar is forming, it spends most of its time near its low and the pullbacks are small (less than a quarter of the height of the growing bar).
  • There is a sense of urgency. You feel like you have to sell but you want a pull-back, yet it never comes.
  • The next two or three bars also have bear bodies that are at least the average size of the recent bull and bear bodies. Even if the bodies are relatively small and the tails are prominent, if the follow-through bar (the bar after the initial breakout bar) is large, the odds of the trend continuing are greater.
  • The spike grows to five to 10 bars without pulling back for more than a bar or so.
  • As a bear breakout goes below a prior significant swing low, the move below the low goes far enough for a scalper to make a profit if he entered on a stop at one tick below that swing low.
  • One or more bars in the spike has a high that is at or just one tick above the close of the prior bar.
  • One or more bars in the spike has an open that is below the close of the prior bar.
  • One or more bars in the spike has a close on its low or just one tick above its low.
  • The high of the bar after a bear trend bar is at or below the low of the bar before the bear trend bar, creating a micro gap, which is a sign of strength. These gaps sometimes become measuring gaps. Although it is not significant to trading, they probably represent the space between a smaller time frame Elliott wave 1 low and a wave 4 pullback, which can touch but not overlap.
  • The overall context makes a breakout likely, like the resumption of a trend after a pullback, or a lower high or higher high test of the bull high after a strong break below the bull trend line.
  • The market has had several strong bear trend days recently.
  • There was growing selling pressure in the trading range, represented by many large bear trend bars, and the bear trend bars were clearly more prominent than the bull trend bars in the range.
  • The first pullback occurs only after three or more bars of breaking out.
  • The first pullback lasts only one or two bars and it follows a bar that is not a strong bull reversal bar.
  • The first pullback does not reach the breakout point and does not hit a breakeven stop (the entry price).
  • The breakout reverses many recent closes and lows. For example, when there is a bull channel and a large bear bar forms, this breakout bar has a low and close that are below the lows and closes of five or even 20 or more bars. A large number of bars reversed by the close of the bear bar is a stronger sign than a similar number of bars reversed by its low.


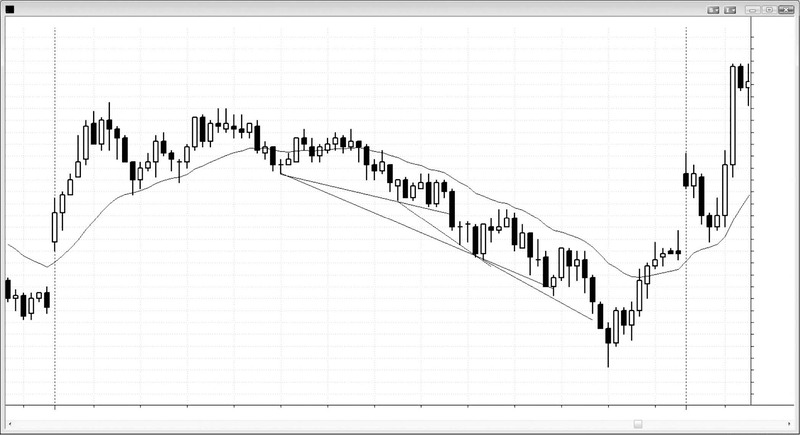
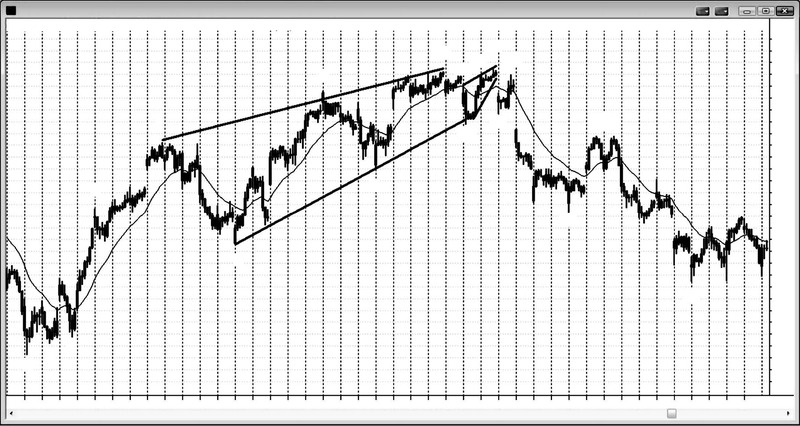
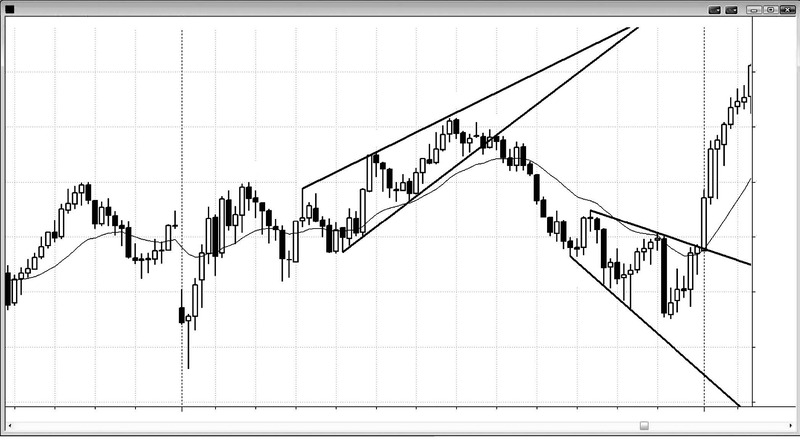
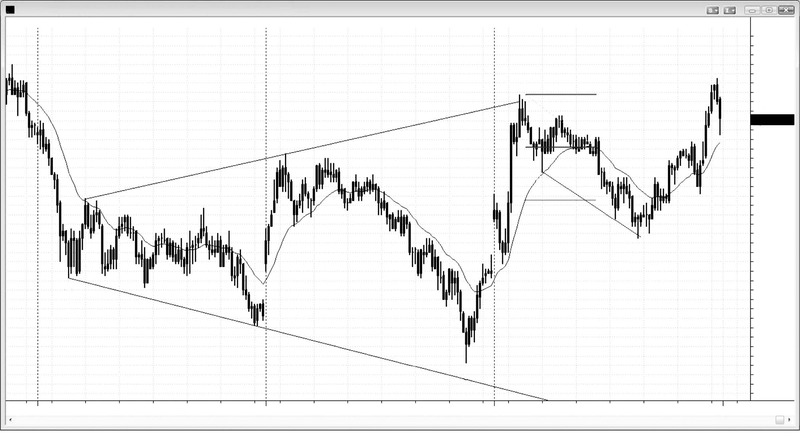
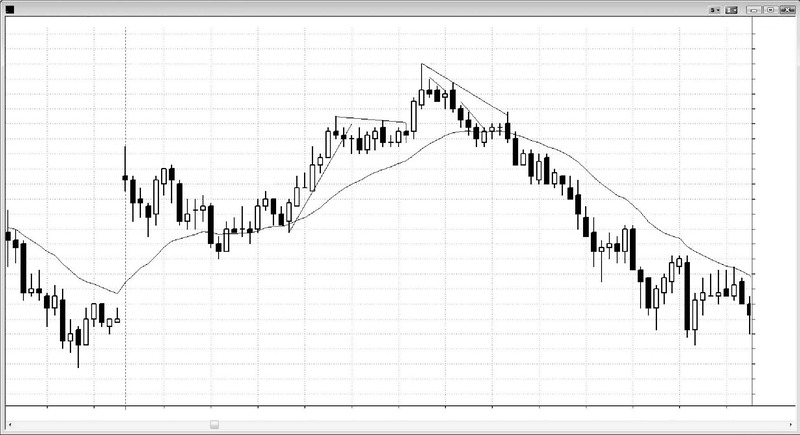
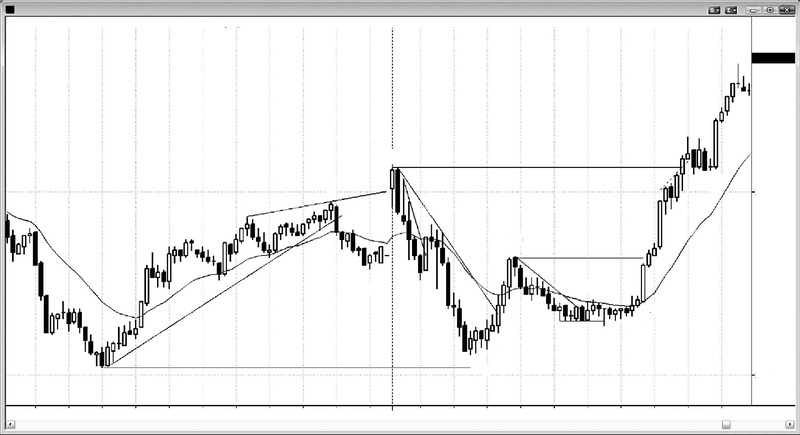
Some Pictures From the Book

Table of Contents:

  • CHAPTER 1 Example of How to Trade a Reversal
  • CHAPTER 2 Signs of Strength in a Reversal
  • CHAPTER 3 Major Trend Reversal
  • CHAPTER 4 Climactic Reversals: A Spike Followed by a Spike in the Opposite Direction
  • CHAPTER 5 Wedges and Other Three-Push Reversal Patterns
  • CHAPTER 6 Expanding Triangles
  • CHAPTER 7 Final Flags
  • CHAPTER 8 Double Top and Bottom Pullbacks
  • CHAPTER 9 Failures
  • CHAPTER 10 Huge Volume Reversals on Daily Charts
  • CHAPTER 11 Key Times of the Day
  • CHAPTER 12 Markets
  • CHAPTER 13 Time Frames and Chart Types
  • CHAPTER 14 Globex, Premarket, Postmarket, and Overnight Market
  • CHAPTER 15 Always In
  • CHAPTER 16 Extreme Scalping
  • CHAPTER 17 Patterns Related to the Premarket
  • CHAPTER 18 Patterns Related to Yesterday: Breakouts, Breakout Pullbacks, and Failed Breakouts
  • CHAPTER 19 Opening Patterns and Reversals
  • CHAPTER 20 Gap Openings: Reversals and Continuations
  • CHAPER 21 Detailed Day Trading Examples
  • CHAPTER 22 Daily, Weekly, and Monthly Charts
  • CHAPTER 23 Options
  • CHAPTER 24 The Best Trades: Putting It All Together
  • CHAPTER 25 Trading Guidelines

AL BROOKS is a technical analysis contributor for Futures magazine and an independent day trader. His approach to reading price charts was developed over two decades in which he changed careers from ophthalmology to trading. Brooks graduated from The University of Chicago Pritzker School of Medicine in 1978 and received a BS in mathematics with honors from Trinity College in 1974. His website, brookspriceaction.com, outlines his trading approach and views as well as hosts a subscription-based daily trading chat room in which Brooks talks with other traders about the market.

Trading Price Action Reversals: Technical Analysis of Price Charts Bar by Bar for the Serious Trader By Al Brooks
author-avatar

About PAC Team

Unlock your trading potential with the Price Action Mastery Team (PAC Team). Our experienced masters have been navigating and dominating the markets for over a decade. Join us for comprehensive trading courses that will elevate your skills and empower you to achieve financial success. Let's conquer the markets together!

Leave a Reply

Your email address will not be published. Required fields are marked *

ten + 13 =