
Articles
Trade Using Pure Price Action
Looking at charts without indicators can make them look naked. But the charts could actually be more reliable and profitable viewed this way. Here’s why.
Price action provides first-hand information about the market, whereas indicators provide lagging or secondary information. In the first part of this two-part article, I will discuss price action by looking at candlestick charts.
PRICE ACTION VS. FIBONACCI TRADING
Candlestick charts are used to describe price action in any given timeframe. Price action can follow a continuation pattern, where price continues in the direction it was moving preceding the pattern’s formation. Otherwise, price action can be in a reversal pattern, indicating the likelihood of a change in price direction from prior to the pattern’s formation.
A critical aspect of price action is identifying support & resistance levels. These levels help identify trading opportunities mainly because these are the areas where price reverses. To trade profitably with price action you have to enter at the reversal of the trend in order to catch the trend close to its beginning. If you buy at the support level, place your stop-loss a few pips below it. If you sell at the resistance level, place your stop-loss a few pips above it.
Traders often use Fibonacci retracement levels to identify potential support & resistance levels. I will discuss Fibonacci retracement levels in next article. Before you can apply Fibonacci levels to your trading, you need to understand the concept of trends, support, and resistance.
TRENDS
Generally speaking, a trend gives you the general direction of price movement. An uptrend is when prices make a series of higher highs and higher lows. A downtrend is when prices make a series of lower highs and lower lows. When prices move without a discernible series they are said to be trending sideways. From a logic standpoint, you go long when the market is in an uptrend and go short when the market is in a downtrend. In a sideways market. you may choose to trade the shorter-term trends or abstain from trading.
Exhaustive candlestick patterns or price-rejection candlesticks indicate when buying or selling pressure is exhausted and gives clues as to when price may continue to trend. The main price reversal candlesticks discussed in this article are more effective at support & resistance levels. When you make trade decisions at these support & resistance levels, you will increase your odds of having successful trades.
TRADE USING SUPPORT & RESISTANCE LEVELS
Resistance is the price level (ceiling) where selling is strong enough to interrupt or reverse an uptrend. There’s a lot of resistance there, so price will have a difficult time going above that point. In the four-hour chart of USDCHF in Figure 1, the horizontal resistance level of the currency pair at 0.9573 is pretty clear. Notice how when the uptrend hits that resistance level, it tumbles down. Notice the bearish candlesticks as price approaches that resistance level. Those bearish candlesticks further confirm the uptrend’s reversal at the resistance level. This should give traders a cue to get out of long positions and take short positions. The bearish engulfing pattern highlighted in blue clearly shows the beginning of a reversal in trend. There are other bearish candlestick patterns that can help you identify a trend reversal. Some of these are pictured in the sidebar “Bearish Candlesticks Or Top Reversal Patterns.”
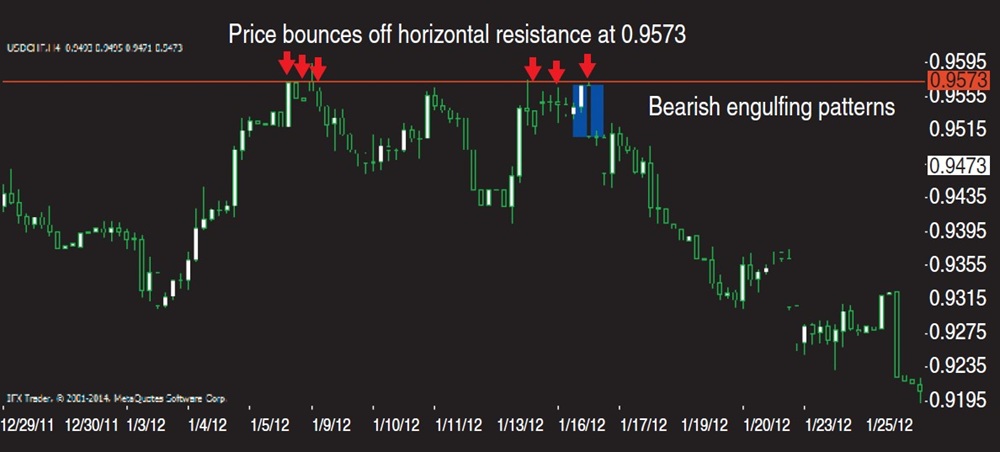
FIGURE 1: BOUNCING OFF RESISTANCE. Here you can clearly see that the horizontal resistance level of USDCHF is at 0.9573.
Support
Support is the price level (floor) where buying is strong enough to interrupt or reverse a down-trend. There’s a tough battle going on to keep prices above this level. In the four-hour chart of GBPJPY in Figure 2, you see the horizontal support level of the GBPJPY currency pair price at $170.68. Notice how prices bounced off this level several times (see arrows). But how do you know when the downward trend will reverse before you start taking long positions? In this case, it’s the harami cross reversal pattern that gave an indication that perhaps the trend is finally starting to turn up. The harami cross is a bottom reversal or bullish candlestick.
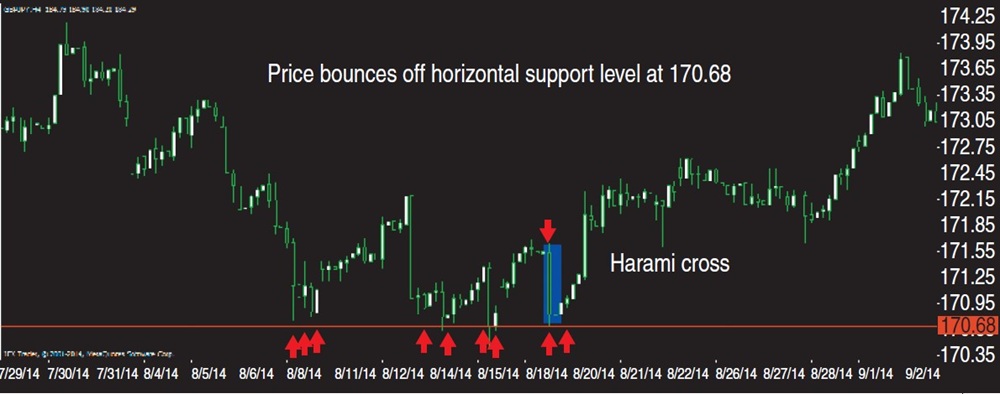
FIGURE 2: BOUNCING OFF SUPPORT. The horizontal support level of GBPJPY is at 170.68. Notice how price bounced off this level several times.
There are other bullish candlestick patterns that can help you identify reversals to the upside as well, a few of which you will find pictured in the sidebar “Bullish Candlesticks Or Bottom Reversal Patterns.” Any one or two of these candlestick patterns that appear after prices hit a support level could indicate a buy signal. Markets oscillate, and over time, support & resistance levels are continuously formed. Another aspect of support & resistance levels is the issue of breakouts and pullbacks.
Mastering Trading With Trading Courses
Breakouts
Breakouts are prices that cross support & resistance levels. They are usually accompanied by high volume and large price movement. I don’t find them reliable because the odds of their continuation are usually not high. They often turn into fakeouts, especially in the currency markets.
Pullbacks
When a price retouches support & resistance levels that were previously broken, it’s referred to as a pullback. When prices pull back, you can think of it as a high-quality signal to enter a trade, since a trend is likely to resume after the pullback. Pullbacks usually occur a few bars after a breakout.
PRICE ACTION IN THE FOREX MARKET
Price action analysis is when you make trading decisions based purely on price bars without any indicators overlaid on them. Here are a few steps on how to approach trading using price action.
- Determine the direction of the market.
- Identity support & resistance areas.
Support & resistance areas should form the foundation of your decisions. You need to wait for price to reach these areas before you initiate your trades. Support & resistance levels are based on historical price action. When you look at a chart of a particular currency pair, you will notice that price had a tendency to reverse at the same level several times in the past. This historical price action helps to identify where the support & resistance levels are on a chart.
In Figure 1, USDCHF was in a downtrend. Initially, the market started as an uptrend until it reached the resistance level. Price bounced off the 0.9573 resistance level. When you see this happening, you have to look for a price rejection candlestick. In this case, a bearish engulfing pattern formed. You can enter a short order immediately after the price rejection candlestick. But how long do you leave this trade open? The converse applies.
As the downtrend progresses you have to look for a price rejection or exhaustive candlestick patterns. You may find some of these candlesticks along the trend, but you’re better off paying more attention to them when you spot them at the support level of the downtrend. That’s when you should exit your trade.
Similarly, a critical look at the chart of GBPJPY in Figure 2 shows a downtrend that reversed at a harami cross. Prices were bouncing off support levels at 170.68. The harami cross suggested that the trend has finally reversed, which means you can take a chance at opening a long position. Exit your long position when you see price rejection or exhaustive candlesticks appear at a resistance level.
TRADING APPROACH
Here’s a recap of some of the points you need to keep in mind.
- Define the direction of the market.
- Look for bearish reversal candlesticks at the resistance level in uptrends. A minimum of one or two bearish candlesticks must appear as confirmation. In downtrends, look for bullish reversal candlesticks at the support level. At least one or two bullish candlesticks must appear as confirmation.
- Enter your positions following confirming reversal candlestick patterns.
- Place your stop-loss a few pips above the resistance level for a short position or below the support level for a long position. You may place trailing stops if the trade continues to move favorably.
REMOVE THE INDICATORS
What are you afraid of? Try removing those indicators and trade on price action or market movement. You can get into trades early. You can try using different timeframes such as 30-minute, hourly, or even daily charts. Be mindful of reversal candlesticks at support & resistance levels. They have a unique characteristic—they tell you when buying or selling pressure is exhausted.