
Articles
The ABC Approach to Trend Trading
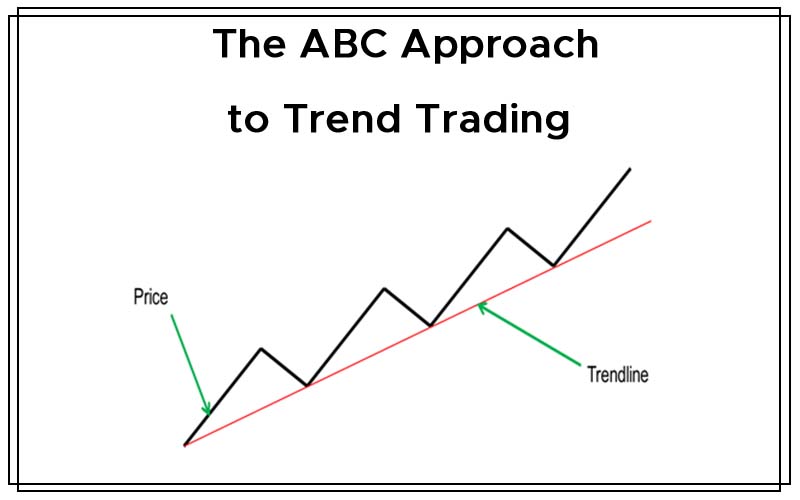
With fundamental releases being the order of the day, the Forex market is ever moving and occasionally taking dives and dips and mostly important forming trends. A trend can be defined as the tendency of an object to extend, incline, or veer in a specified direction. In this case it’s the tendency of the market to incline and extend in a particular direction, often due to the influence of a major fundamental release.
So how to do we approach trends?
- Buy when oversold and sell when overbought
- Buy or sell when historical highs and lows are broken
- Diversify using currency correlation.
A. Buy when oversold and sell when overbought
This is the simplest profit generating business logic known to many as often used by traders. So if it’s this easy, then why don’t people get it right?
In order to master this approach, follow these three fundamental rules:
- Identify the trend
- Insert a preferred oscillator
- Sort out your entry signals, making sure that you select those favoring the trend’s direction only.
This will significantly increase your winning probability. Practice this and over time you will be perfect.
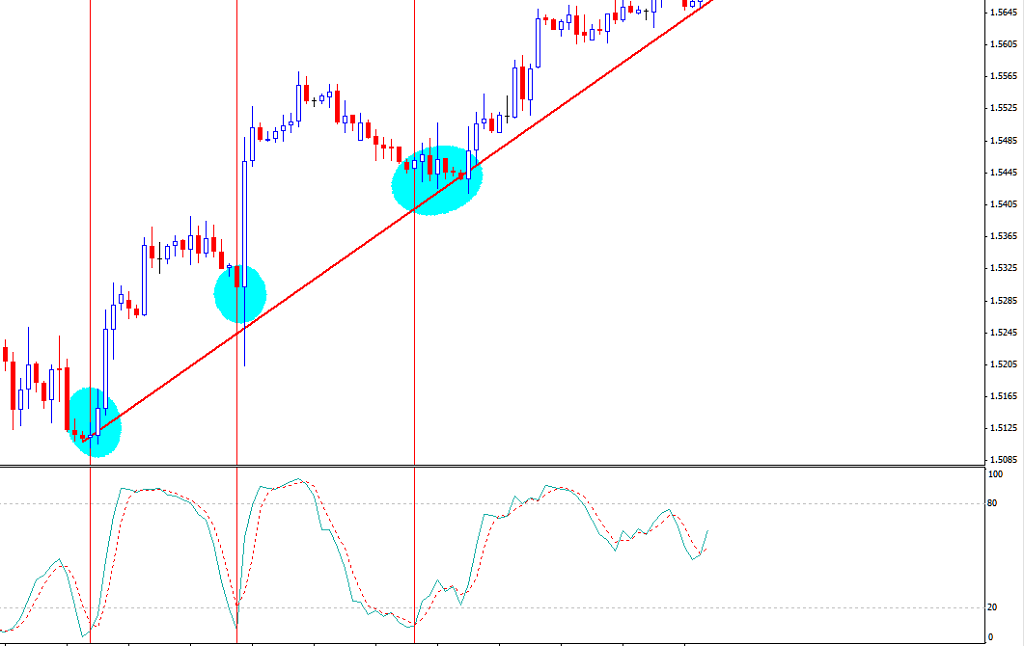
As illustrated on the chart above, there are three trend agreeing signal, which fit perfectly into the approach.
B. Buy or sell when historical highs and lows are broken
These are commonly referred to as break outs. Remember that markets are influenced by traders’ greed, which is translated into a market sentiment. A good example is gold over the last 10 years.
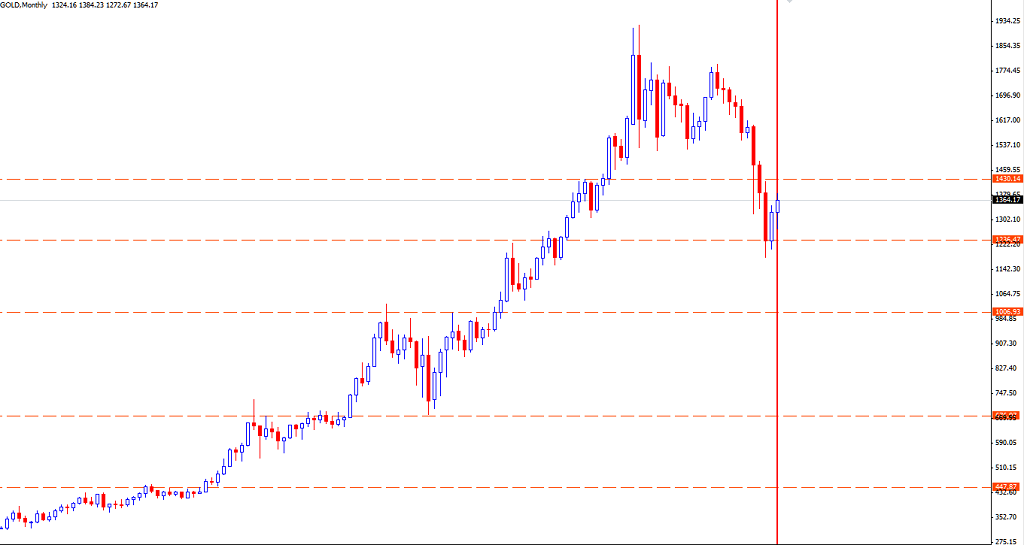
All the marked levels represent areas that were termed as historical highs. After each was broken, a rally followed.
So how and when do we get in? A good answer would be “just as everyone else is doing the same”, which by the way is awesomely correct. At this point we must note that markets are controlled by an important aspect termed as “order flow”. This translates to “the number of buy orders against sell orders”.
The up break up is evidence that there were significantly more buy orders, leading to an increased demand, which of course culminates in an increase in buying price. Therefore buying on breakouts makes all the profit sense. To answer our question, we would want to be sure that the high/low is broken before executing the orders. An easy way is to wait for a bull or bear bar that opens and closes above this key level. It’s quite simple, right?
C. Diversify using currency correlation
According to Investopedia, correlation in finance is a statistical measure of how two securities move in relation to each other. In Forex, it’s the measure to which currency pair trends in relation to another currency. Trend correlation is the product of common base or counter currency.
Example: EUR/USD and GBP/USD share a common counter currency, the USD. In a particular day, the NFP data shows that unemployment has hit 11% in the US. This is bad news for the US economy and the USD too. We would expect US dollar devaluation, in comparison to other majors. On the charts, this would be evidenced by price rallies on the two pairs. We can therefore say that the two are positively correlated. The opposite would be seen in pairs that have the USD as the base. In this case the USD/CAD and USD/CHF would experience massive dips.
The table below indicates the percentage correlation for the different commonly traded pairs over hourly and daily time frames.
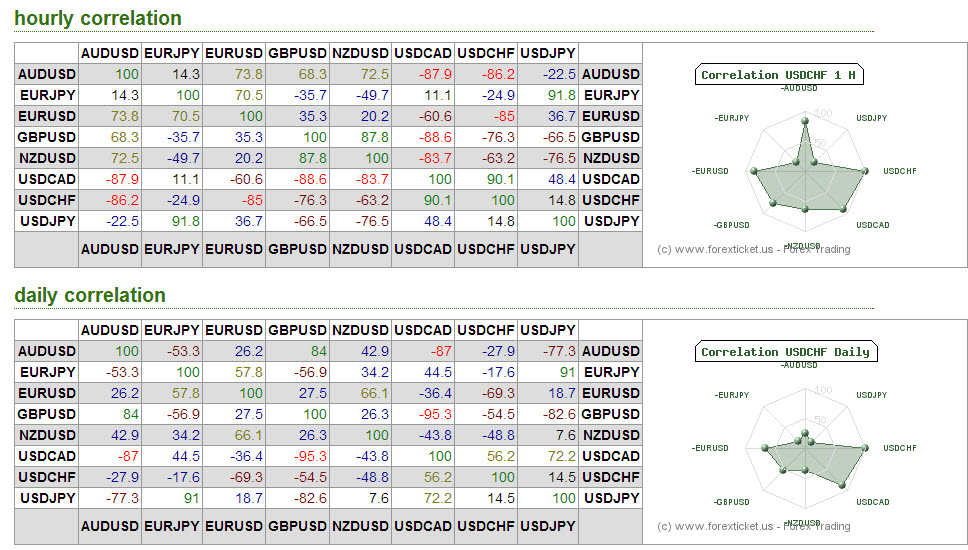
From the table, if we have a bullish trend on the USD/JPY, there is a 91% chance that we would have a bullish trend on the EUR/JPY.
From the relative percentages, we can classify the pairs into baskets. Example basket 1 would have BUY: eur/usd, gbp/usd and SELL usd/cad, usd/chf.
Bottom line; if you see a trend on one pair, there is possibly a trend on the other pairs in the basket as well.
From the three approaches, we can see why trend trading is quite popular and ideally the way to go. Remember the trend is you friend as long as you ride on it!

