
Articles
What are Supply and Demand Zones and How to Trade with Them
Trading the financial markets often feels like chaos—random price moves, false breakouts, and sudden reversals that leave traders frustrated. Yet, beneath the noise lies one of the most powerful forces driving price action: supply and demand zones. These zones reveal where big players are likely entering or exiting the market, giving retail traders a roadmap to follow instead of guessing. In this guide, you’ll discover exactly what supply and demand zones are, why they matter, and how to trade them effectively with confidence. Whether you’re a beginner struggling to find consistent entries or an experienced trader refining your edge, this article will give you a practical, step-by-step framework to master supply and demand trading.
What Are Supply and Demand Zones?
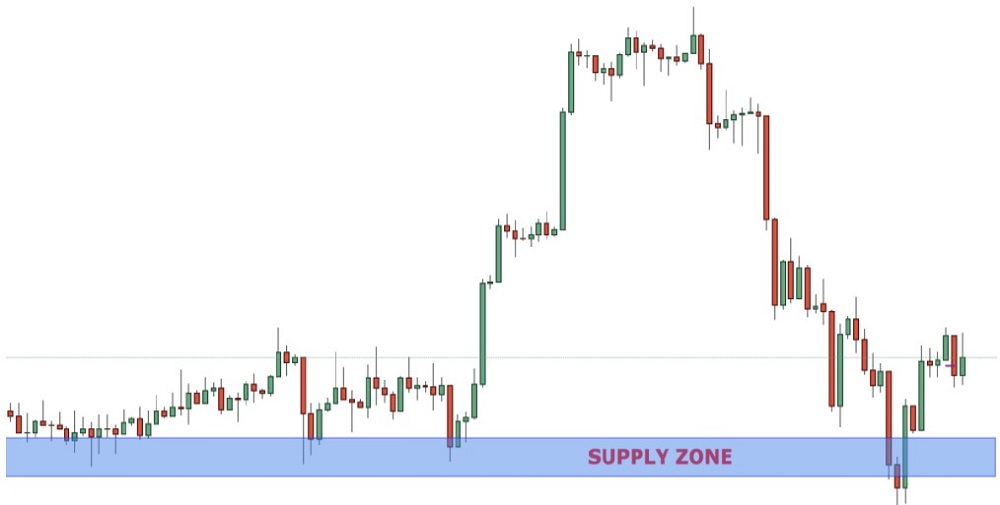
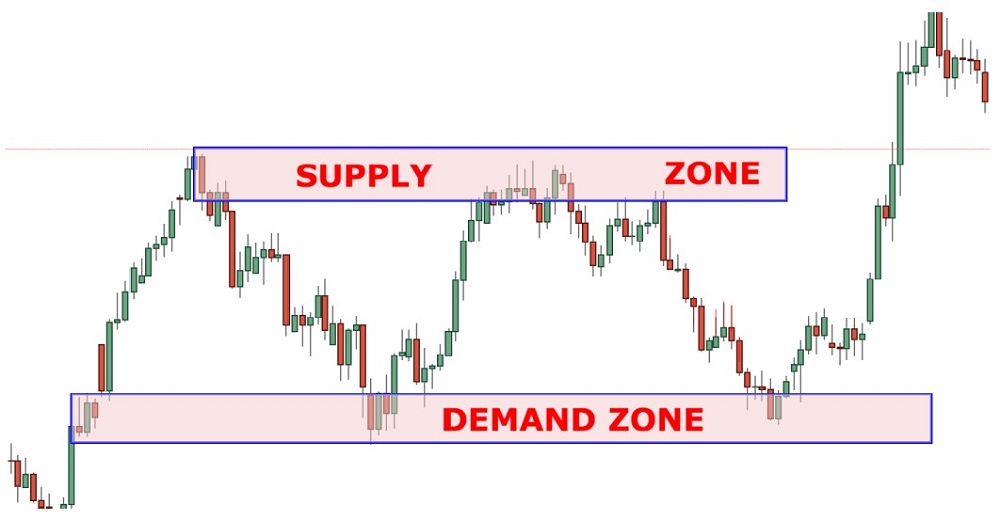
Supply and demand zones mark key areas on a price chart where market momentum often pauses or shifts direction. These zones highlight regions where buying or selling pressure is heavily concentrated, making them critical reference points for traders seeking to anticipate future price moves. A supply zone forms when sellers dominate the market.
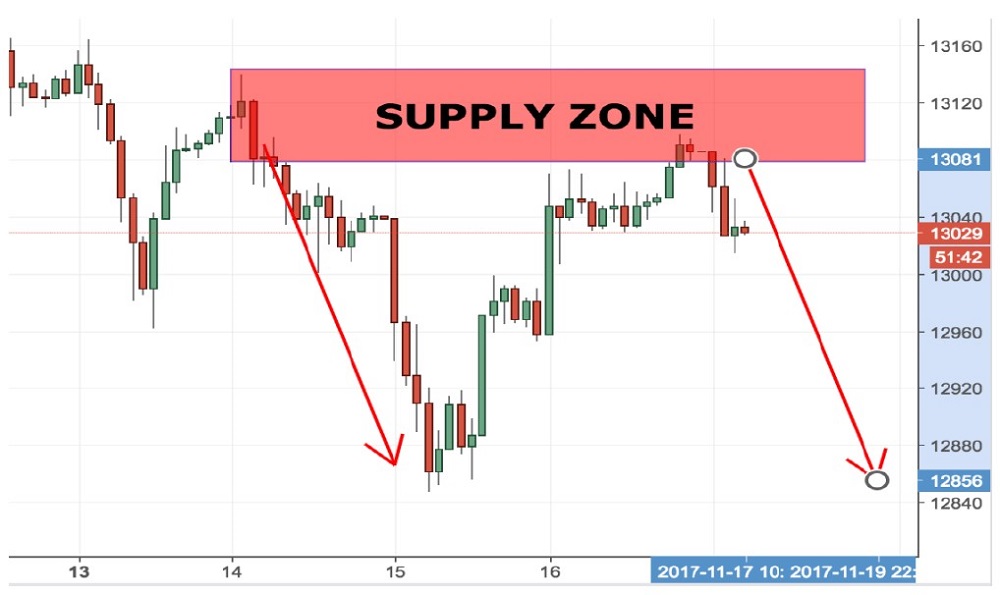
Example of a supply zone: Sellers dominate the market as price reverses sharply from the red resistance area.
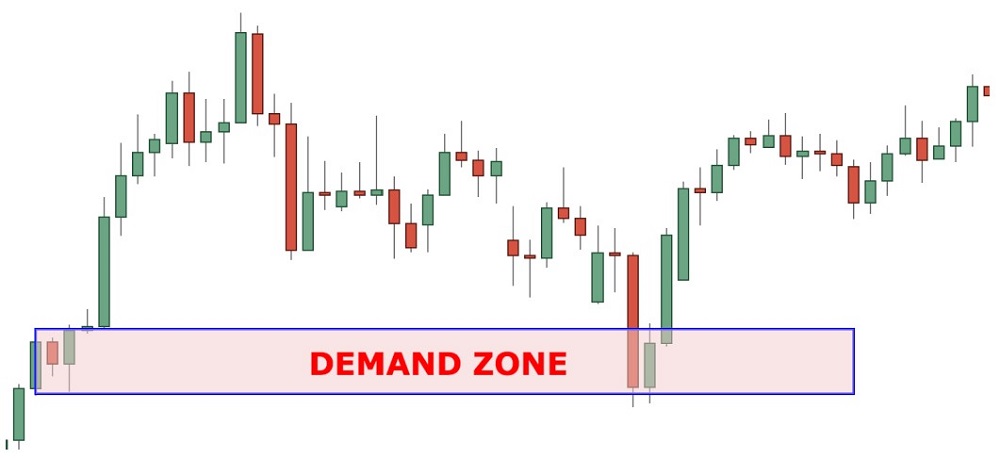
In these areas, the abundance of sell orders pushes prices lower as traders accept reduced prices to offload their positions. On the other hand, a demand zone appears when buyers take control. Here, strong buying interest drives prices upward, as traders compete to purchase at increasingly higher levels. By recognizing these zones, traders can better understand where market imbalances occur, giving them valuable insight into potential reversals, breakouts, or continuation of trends.
“Example of a demand zone: Buyers dominate as price repeatedly bounces from the green support area.”
Support and Resistance Levels vs. Zones
Traditional support and resistance levels are often drawn as single horizontal lines on a chart. Supply and demand zones, on the other hand, represent ranges where institutional orders are clustered. The difference is subtle but important:
- Levels provide a quick reference point but can be prone to false breakouts.
- Zones capture the broader area where large players entered or exited, offering more context and durability.
Understanding this distinction prevents traders from being shaken out by small wicks or intraday volatility. In practice, zones act as “thicker” layers of support or resistance, providing a more reliable foundation for trade planning.
Why Supply and Demand Zones Matter
Supply and demand zones play a critical role in modern trading because they reflect the very foundation of how markets move—imbalances between buyers and sellers. Unlike traditional support and resistance levels that are often drawn from arbitrary highs and lows, these zones capture the real footprints of institutional activity. When large banks, funds, or professional traders step into the market, they leave behind areas where price reacts sharply.
For retail traders, recognizing these zones provides a practical edge. They highlight where momentum is most likely to stall, reverse, or accelerate, giving traders a clearer picture of potential entry and exit points. More importantly, supply and demand zones are adaptable: they can be used across different timeframes, markets, and strategies, making them valuable whether you’re trading forex, stocks, or commodities.
In short, these zones matter because they go beyond theory—they show you where money has actually moved the market. By focusing on these high-interest areas, traders can improve accuracy, manage risk more effectively, and build confidence in their decision-making.
Supply and Demand as a Forex Trading Strategy
Forex is one of the best markets to apply supply and demand because of its massive liquidity and constant institutional participation. Unlike equities or commodities, forex runs 24/5 and leaves clear institutional footprints. When sellers overwhelm buyers, a supply zone forms and sharp declines follow. When buyers dominate, a demand zone appears, often driving price higher. For example: A revisit of a demand zone on EUR/USD often sparks renewed buying. A strong supply zone on GBP/JPY may trigger heavy selling. This makes forex the perfect environment to practice supply and demand, where imbalances show up clearly and trading opportunities repeat across timeframes.
How to Identify and Spot Supply & Demand Zones
Learning to identify supply and demand zones is a cornerstone of price action trading. These areas act like natural barriers on the chart, showing where price is likely to pause, reverse, or accelerate. By mastering how to spot them, traders can better anticipate market moves and plan their entries with confidence.
- Step 1: Basic Recognition: Start with the fundamental signs that reveal where zones are forming:
- Price Stalling or Reversals – Zones often emerge where price repeatedly fails to push higher or lower.
- Repeated Reactions – If a level consistently creates bounces, it strengthens the case for a valid zone.
- Volume Spikes – Sudden increases in volume often confirm institutional participation.
- Supporting Indicators – Tools like RSI or MACD can highlight exhaustion or momentum shifts that align with zones.
These simple cues form the foundation of supply and demand analysis.
- Step 2: Spotting Supply vs. Demand: Once you understand the basics, you can refine your analysis by distinguishing between supply and demand zones.
- Supply Zones (sellers in control):
- Sharp declines following a strong rally
- Failed attempts to break above recent highs
- Consolidation before a steep drop
- Heavy volume during reversals
- Supply Zones (sellers in control):
-
-
-
- Demand Zones (buyers in control):
- Quick rebounds from lower levels
- Noticeable volume surges during upward reversals
- Short consolidations before a rally begins
- Aggressive buying after a pullback
- Demand Zones (buyers in control):
-
-
The more times price reacts to a zone, the stronger and more reliable it becomes. By combining these basic cues with a clear understanding of supply and demand behavior, traders can identify high-probability zones. This helps them anticipate whether a move is likely to continue or reverse.
Candlesticks and Supply and Demand
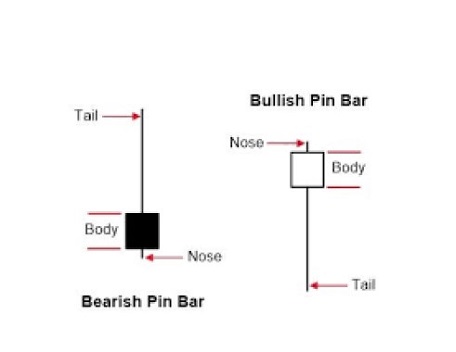
Candlesticks give traders a practical way to confirm supply and demand zones in real time. Instead of relying only on zones, candlestick patterns show whether buyers or sellers are actively defending a level. One of the most important patterns to watch is the Pin Bar. A bearish pin bar forming at a supply zone often signals rejection, showing that sellers are stepping in aggressively. A bullish pin bar, on the other hand, may indicate that buyers are defending a demand zone.
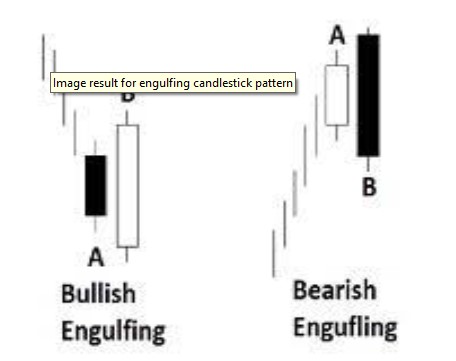
Another widely used pattern is the Engulfing Candle. A bullish engulfing candle at a demand zone suggests fresh buying interest, while a bearish engulfing candle appearing at a supply zone often signals strong selling pressure.
To put these concepts into practice, let’s look at a real chart example. Below you can see a demand zone where both a pin bar and multiple bullish engulfing candles appeared. Each time price touched the zone, it quickly reversed upward, confirming that buyers were in control.
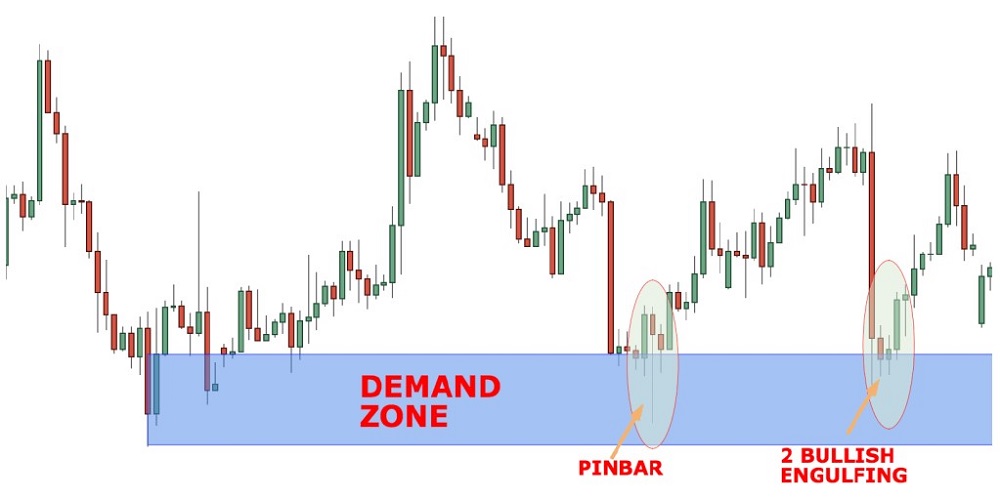
By combining supply and demand zones with candlestick confirmation, traders turn theory into clear, actionable trade setups. This simple yet powerful approach increases confidence and helps avoid false signals in live markets.
Risks and Mistakes in Supply and Demand Trading
Trading with supply and demand zones can be powerful, but it’s not without pitfalls. Many traders focus only on drawing zones while ignoring the risks and challenges that come with them. Here are the key points to keep in mind:
- Common Risks
- Zone Breaks: Even strong zones can fail when news, liquidity changes, or institutional activity drive price through them.
- False Confidence: Clean charts can give a false sense of security. Oversizing positions without proper risk control often leads to big losses.
- Timeframe Gaps: A zone on a 15-minute chart might be irrelevant on the daily timeframe. Misalignment creates false signals.
- Changing Market Conditions: A setup that worked in a trending market may fail in a range. Markets evolve, and zones lose strength over time.
- Mistakes to Avoid
- Behavioral Errors
- Overtrading: Opening too many trades just because zones appear on the chart.
- Ignoring Market Drivers: News events or central bank decisions can override any technical level.
- Failing to Adapt: Zones that once worked may no longer hold value if conditions shift.
- Technical Errors
- Drawing Zones Too Wide: Precision matters—focus on the candles around sharp reversals.
- Ignoring Multiple Timeframes: Strong zones usually align across both higher and lower timeframes.
- Over-Reliance on Tools: Indicators can help, but confirmation must always come from price action and volume.
- Poor Risk Management: Without stop-loss and position sizing, even the best zone can turn into a costly mistake.
- Behavioral Errors
By being aware of these risks and avoiding common mistakes, traders can use supply and demand zones with more confidence and consistency. The goal isn’t to avoid losses entirely, but to manage them wisely while protecting long-term profitability.
Recommended Tools for Zone Analysis
Technology can make supply and demand trading more precise, but tools should support—not replace—your decision-making.
- Zone Detection Software: Highlights areas of heavy buying or selling to save time in chart analysis.
- Volume Profile Tools: Reveal how much activity occurred at different price levels, confirming where zones are likely strongest.
- Backtesting Platforms: Let you test your supply and demand strategies on historical data to refine accuracy.
These tools accelerate learning and execution, but traders still need to rely on their own chart-reading skills for the best results.
Advanced Methods for Identifying Supply and Demand Zones
While basic zone drawing works for many traders, advanced methods can sharpen precision and improve trade entries. Here are a few refined techniques:
- Order Blocks: Popular in smart money concepts, order blocks highlight areas where large institutions left unfilled orders. These zones often mark turning points that retail traders overlook.
- Fair Value Gaps (FVGs): A sudden price imbalance creates gaps on the chart, showing areas where demand or supply wasn’t fully matched. Price often returns to these gaps to “rebalance.”
- Wyckoff Method: Richard Wyckoff’s framework helps traders understand accumulation (demand building) and distribution (supply building). These phases naturally create strong trading zones.
- Market Profile Analysis: By analyzing volume at price, traders can spot value areas where strong participation occurred. Supply and demand zones aligned with high-volume nodes are more reliable.
- Footprint Charts: Cluster analysis inside each candle shows where buyers and sellers were most aggressive, helping refine zones beyond what standard charts reveal.
- Alternative Chart Types: Range bars or Renko charts filter out noise, making supply and demand imbalances clearer compared to traditional candlesticks.
- Liquidity Pools: Price often targets areas where stop orders are clustered. Identifying liquidity pools can help anticipate where new zones may form.
These advanced tools should not replace the basics but rather complement them, allowing you to confirm zones with more confidence and context.
Different Types of Supply and Demand Formations
Not all supply and demand zones look the same. Market structure creates several recurring formations that traders should learn to recognize:
- DBU (Down → Base → Up): A downtrend pauses, forms a base, and then reverses upward.
- UBU (Up → Base → Up): A continuation pattern where an uptrend consolidates briefly before resuming.
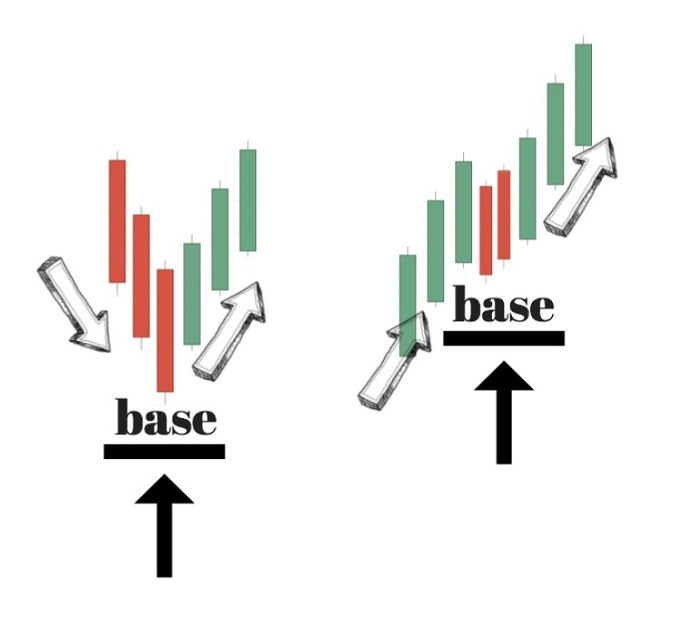
Visual examples of DBU (Down → Base → Up) and UBU (Up → Base → Up) supply and demand formations.
- UBD (Up → Base → Down): An uptrend stalls and transitions into a downtrend after forming a base.
- DBD (Down → Base → Down): A bearish continuation where a downtrend consolidates before pushing lower.
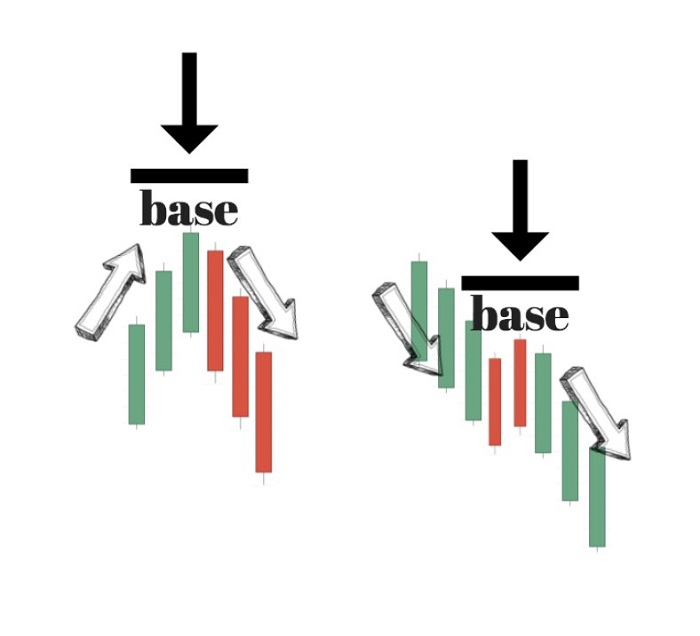
Visual examples of UBD (Up → Base → Down) and DBD (Down → Base → Down) supply and demand formations.
These patterns illustrate how supply and demand zones evolve within broader market cycles. Spotting them early helps traders anticipate whether a move is likely to reverse or continue, allowing for smarter entries and exits.


Best Timeframes for Zone Trading
Choosing the right timeframe is one of the most overlooked aspects of supply and demand trading. Major zones are best identified on higher timeframes such as the daily and weekly charts, where institutional activity is clearer and levels are tested multiple times. These zones act as strong foundations for long-term trading decisions.
For precision entries, traders often move down to 4-hour or 1-hour charts. These shorter timeframes allow you to refine your entries within the broader zones identified on higher charts. By combining both, you create a multi-timeframe framework—large zones for context, smaller zones for execution. This dual perspective helps filter out noise and improves both accuracy and risk management.
How to Mark Supply and Demand Zones
After spotting potential supply and demand zones on a chart, the next step is to clearly mark them so you can reference these areas during future analysis. Properly marking zones makes it easier to recognize where price may react, stall, or reverse. Here’s a simple process to follow:
1. Draw horizontal lines to outline the zone: Start by placing horizontal lines at the upper and lower boundaries of the identified zone. Extend the lines across the chart so the zone is clearly visible as price evolves.
2. Use colors for better visibility: To distinguish these zones from other lines or indicators, shade the area between your horizontal lines. Adding a unique color fill will help highlight the zone and make it stand out when reviewing price action.
3. Label the zones for clarity: Give each zone a simple label to remind yourself what it represents. For instance, you can mark demand zones as “DZ” and supply zones as “SZ.” Short labels save time and reduce confusion when multiple levels are drawn on your chart.
4. Review and fine-tune: Once the zones are marked, revisit them in the context of the broader price action. Adjust their boundaries if necessary to ensure they accurately capture the area where buyers or sellers stepped in.
Marking supply and demand zones is a straightforward yet powerful technique. By keeping your charts clean and organized with clear zones, you’ll be better equipped to identify key support and resistance areas and make more confident trading decisions.
Analyzing Market Conditions
After marking your zones, the next step is to view them in the bigger picture. Identifying zones is only part of the process; understanding the broader market context is equally important.
1. Market Trends
- Uptrend: Demand zones usually hold stronger as buyers step in repeatedly.
- Downtrend: Supply zones dominate, offering better opportunities for sellers.
- Ranging Market: Both supply and demand zones can act as turning points, but tighter risk management is needed.
2. Volume Analysis
- Rising volume near a zone → confirms participation and strengthens the level.
- Weak volume near a zone → signals that the level may be losing significance.
Recognizing these broader conditions helps traders avoid false signals and align trades with market momentum. Once you’ve identified key supply and demand zones and assessed the broader context, the next step is learning how to trade these areas effectively.
Supply and Demand Zone Trading Strategies
Supply and demand zones are more than just areas on a chart—they can serve as the foundation for a complete trading strategy. By understanding how price reacts to these zones, traders can plan entries, exits, and manage risk more effectively. Below are some of the most common approaches to trading with supply and demand zones:
1. Trading Reversals: One widely used method is to look for zones where price has previously reversed. When price revisits a demand zone, traders often watch for bullish confirmation signals—such as reversal candlestick patterns or oversold readings on indicators—to anticipate another bounce. Similarly, when price approaches a supply zone, bearish signals may suggest a potential turning point.
2. Trading Breakouts: Zones where price has stalled in the past can also act as springboards for breakouts. If price challenges a supply zone, for example, signs of strong momentum—like bullish candlestick formations or a surge in volume—can indicate a breakout to the upside. Breakout traders use these signals to catch sharp moves beyond established zones.
3. Trading with the Trend: Supply and demand zones can help traders align their entries with the broader trend. In an uptrend, demand zones often present attractive buying opportunities, as they highlight areas where buyers have consistently stepped in. In a downtrend, supply zones can mark potential entry points for short trades.
4. Setting Stop-Loss and Take-Profit Levels: Another practical use of these zones is in risk management. Traders frequently place stop-loss orders just below a demand zone to protect against breakdowns, or just above a supply zone to cap risk on short trades. Likewise, take-profit targets can be placed near opposing zones to secure gains when price reaches likely turning points.
With consistent practice, traders develop a sharper eye for recognizing how supply and demand zones influence price behavior. Over time, this skill becomes a powerful tool for building confidence and precision in trading decisions.
When to Enter Trades
Knowing where zones exist is only half the battle—deciding when to enter is just as important. Traders generally use three main approaches:
- Aggressive Entry: Entering on the first touch of the zone. Fast and rewarding but higher risk.
- Conservative Entry: Waiting for the zone to be retested and confirmed by candlestick patterns or technical indicators. Lower risk, but sometimes you miss the move.
- Breakout Entry: Entering when price breaks through a zone with strong momentum. Useful for trend-following strategies.
Selecting the right entry style depends on your risk tolerance and trading style, but consistency in approach is key.
Examples of Supply and Demand in Action
Theory only becomes meaningful when it meets practice. Real-world charts show how dramatically price can react to supply and demand zones. For instance, in USDCAD, demand zones often trigger sharp rebounds as institutional buyers step in.
Meanwhile, in GBPJPY, supply zones have repeatedly produced strong sell-offs when sellers dominated the order flow. These examples highlight that zones are not abstract concepts—they reflect real buying and selling behavior. The more charts traders study, the faster they develop an instinctive ability to recognize these areas and act with confidence.
Importance of a Well-Defined Trading Strategy
Relying solely on supply and demand zones without a structured plan is risky. Successful traders integrate these zones into a comprehensive trading strategy that includes:
- Market Analysis: Regularly reviewing charts to identify potential opportunities.
- Risk Management: Setting clear stop-loss and take-profit levels to protect capital.
- Trading Goals: Defining both short-term and long-term objectives, such as consistent monthly returns or account growth targets.
A well-defined strategy ensures discipline and reduces emotional decision-making. It also helps traders adapt to changing market conditions while maintaining consistency in execution.
Setting Stop Loss & Targets
Risk management is what separates consistent traders from the rest. Supply and demand zones provide natural boundaries for both stop-loss and profit-taking:
- Stop Loss: Place stops just beyond the outer edge of a zone to protect against false breakouts. Adjust for average volatility to avoid premature exits.
- Take Profit: Use opposing zones or previous swing highs/lows as targets. Stick to risk-reward ratios of at least 1:2 to maintain profitability over time.
By aligning your stop and target levels with zones, you turn them into practical tools for both protecting capital and capturing profits.
Pros and Cons of Supply and Demand Zones
- Pros
- Easy to recognize visually, since zones stand out as sharp price reversals.
- Provide natural levels for planning entries, exits, and risk management.
- Work flexibly across strategies like reversals, breakouts, and trend-following.
- Combine well with technical indicators (e.g., RSI, MACD, or moving averages) for confirmation.
- Cons
- Subjectivity: Different traders may draw zones differently, leading to inconsistent setups.
- Context Dependency: Zones often lose accuracy if not aligned with trend direction or higher timeframe analysis.
- Learning Curve: Drawing precise zones takes practice and experience.
- Dynamic Nature: Zones evolve as markets shift—what was valid last week may weaken today.
Conclusion
Trading supply and demand zones is more than drawing lines on a chart—it’s about reading the story of buyers and sellers behind every move. These zones expose where institutional players step in, creating opportunities for retail traders to act with clarity instead of guesswork. By learning how to spot, mark, and trade these levels across different timeframes, you’ll build a practical strategy that improves accuracy, manages risk, and helps you trade with confidence in any market.