Articles
Speed Resistance Lines

Need to determine support and resistance? Try this. It is not unusual to come across situations in which you see a market trending and think it may be too late to get in. To check, you wait for a pullback to determine if that might be a good entry point. But is this pullback a correction or a trend reversal? Determining whether a trend is going to continue or reverse is critical to a trader. Speed resistance lines, which were developed by technician Edson Gould, can help determine whether the market is correcting itself or a trend will reverse. These lines measure the speed of a trend by measuring the rate of ascent or descent. They are similar to Fibonacci fan lines, and you may have heard them also being referred to as one-third or two-thirds lines. Speed resistance lines are a hybrid of simple trendlines and Fibonacci retracement levels, and they are helpful in creating support and resistance levels.
IN THEORY
Markets in a strong trend will usually retrace at one point or another, giving you the opportunity to enter positions if you missed the opportunity to get in at the beginning of the trend or if you want to enter additional positions. Technicians are of the opinion that whenever there is a move in the opposite direction of the major trend, prices will retrace one-third to two-thirds of the previous move. Those of you familiar with Fibonacci numbers will notice the similarity to speed resistance lines. The one-third retracement level is the minimum retracement you can expect. At this level, you will see more trades enter the market, making the retracement level the primary support. If prices go below the 33.3% retracement level, then it is likely they will fall to the 66.6%level, which then becomes the second support level.
If an uptrend is in the process of correcting itself, the downside correction will usually stop at the higher speed line (a retracement of 33.3%, but referred to as a two-thirds speed line). If not, prices will drop to the lower speed line. If the lower line is also broken, prices will probably continue all the way to the beginning of the trend or even lower.
In a downtrend, if prices break above the lower line, it indicates prices may rally to the higher line. If the higher line were broken, it would mean prices could rally to where they were at the beginning of the trend. It is better to wait for the close to be below or above the speed lines for two consecutive days in order to get a confirmation.
ON DRAWING SPEED RESISTANCE LINES
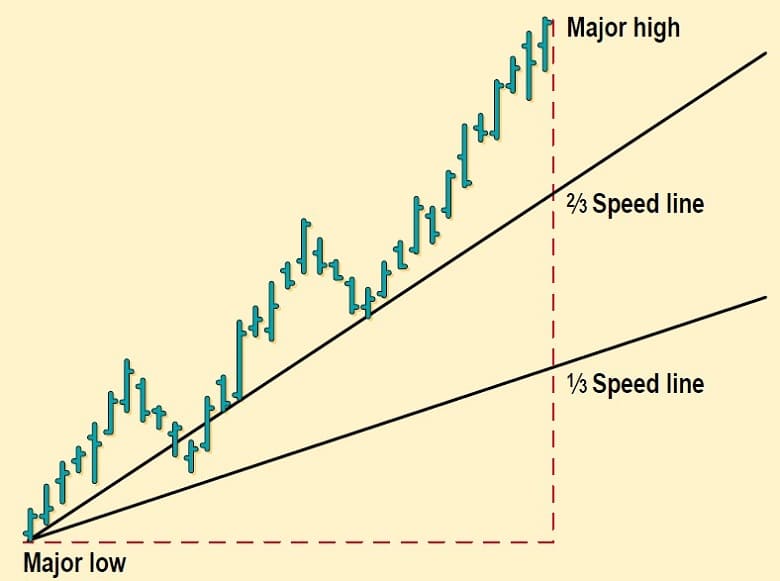
Speed resistance lines enable you to determine how fast an advance or decline will take place by taking both time and price into consideration. They measure the rate of change in trends. A rally or drop in prices is measured from the extreme intraday high or low rather than the ending price. Each time a new high is set in an uptrend or a new low in a downtrend, a set of new lines must be constructed. You will notice from Figure 1 that speed lines are drawn through the prices, as opposed to below or above them as with simple trendlines. To draw a speed resistance line for an upward trend, do the following:
- Identify the major low and major high of a trend.
- Draw a line connecting these two points.
- Draw a vertical line from the major high to the level of the major low.
- Divide this vertical line into thirds.
- Draw one line from the major low to the one-third level and another to the two-thirds level.
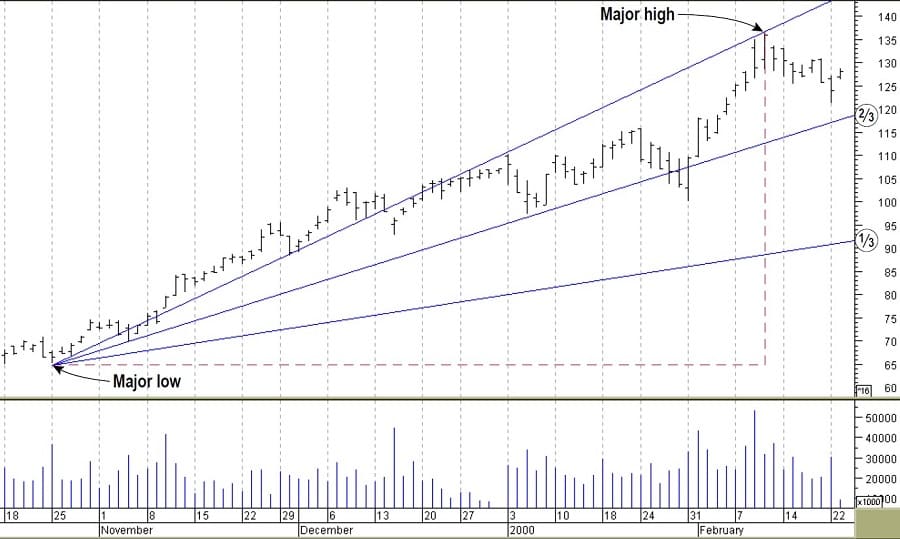
FIGURE 1: SPEED RESISTANCE LINES. Speed resistance lines provide support and resistance levels by taking retracement levels into consideration. The two-thirds and one-third levels are important in creating support and resistance levels.
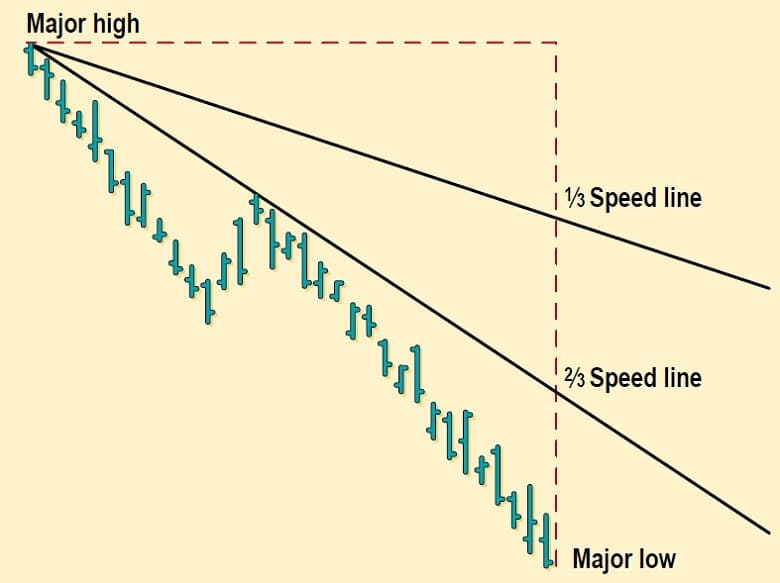
Figure 2 shows how speed resistance lines are constructed in upward trending markets. Figure 3 shows how to draw speed resistance lines in a downward trend. Similar principles are applied for both markets.
- FIGURE 2: SPEED LINES IN AN UPTREND. Speed resistance lines are drawn with reference to the major high and low of a trend. The speedlines act as support and resistance levels.
- FIGURE 3: SPEED LINES IN A DOWNTREND. If you’re looking to enter a long position in a security that has been in a strong downtrend, you can use speed resistance lines to determine your entry and exit points.
ON USING SPEED RESISTANCE LINES
Applying speed resistance lines on the Dow Jones Industrial Average (DJIA) from October 1999 to February 2000 is a classic example of how speed resistance lines can be utilized (Figure 4). From October 18, 1999 (major low), to January 14, 2000 (major high), the DJIA was consistently trending up. The only exception was on January 4, 2000, when the close was below the two-thirds line. However, this didn’t happen for two consecutive days, which indicated this pullback was a correction. The index moved back up above the two-thirds line.
It was not until January 24, 2000, that the DJIA closed below the two-thirds line. It was a matter of waiting until the following day’s close to determine whether the upward trend was reversing. The next day’s close was below the two-thirds line. We could take this to be a confirmation signal that the action in the DJIA was no longer a correction but a downward trend.
Since the index broke below the two-thirds line, the next level to watch is the one-third line, which will be your next support level. Prices remained between the two-thirds and one-third lines till February 9, 2000, when the DJIA closed below the one-third line. Again, there were two consecutive days of the index closing below the one-third line.
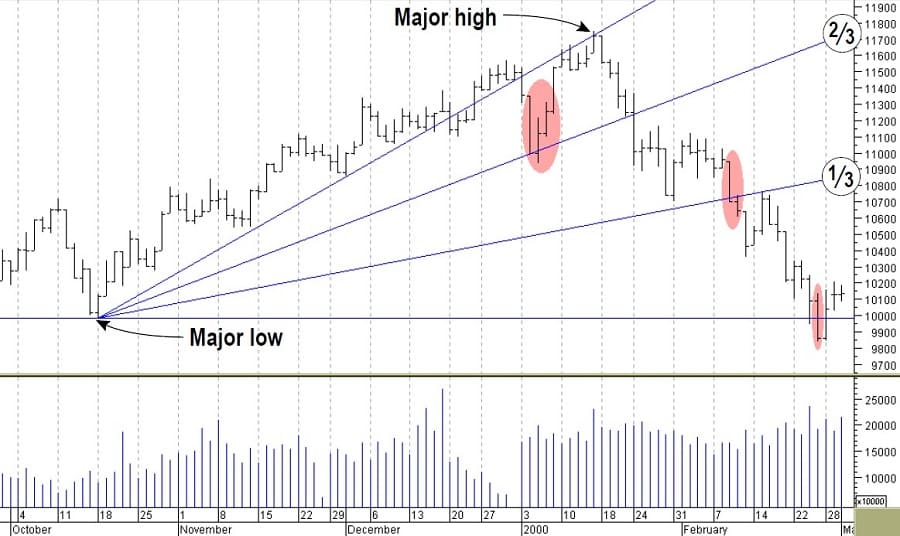
FIGURE 4: DJIA. By constructing speed resistance lines for the DJIA, you can see the downward price action that started in January went as low as the major low.
According to the speed resistance line theory, this meant you could expect to have prices drop to as low as they were at the beginning of the trend. From the example in Figure 4, you can see that prices did reach this level; in fact, they closed below it on February 25, 2000, but not for two consecutive days. The action of the DJIA confirms the market is in a downward trend and will only reverse when prices go higher than the lower speed resistance line.
Speed resistance lines act as support and resistance levels. Once they are broken, they reverse their roles. For example, during the correction of an uptrend, if the upper line (the two-thirds line) is broken and prices fall to the one-third line and rally from there, that upper line acts as a resistance barrier. When this upper line is broken, it reverses its role from resistance to support. In a downtrend, the two-thirds line acts as a resistance level, which when broken becomes a support level.
Figure 5 displays an example of how speed resistance lines can be used in a downward trending market. America Online [AOL] had been in a downtrend since December 13, 1999. The major low of the current trend was at 483/16 on February 22, 2000. On the following day (February 23, 2000), there was unusual activity, suggesting the possibility of a reverse in investor sentiment. By drawing the speed resistance lines, I was able to determine where my entry and exit points would be for a trade. The two-thirds line would be the first resistance level, and if prices closed above it for two consecutive days, I would enter a long position.
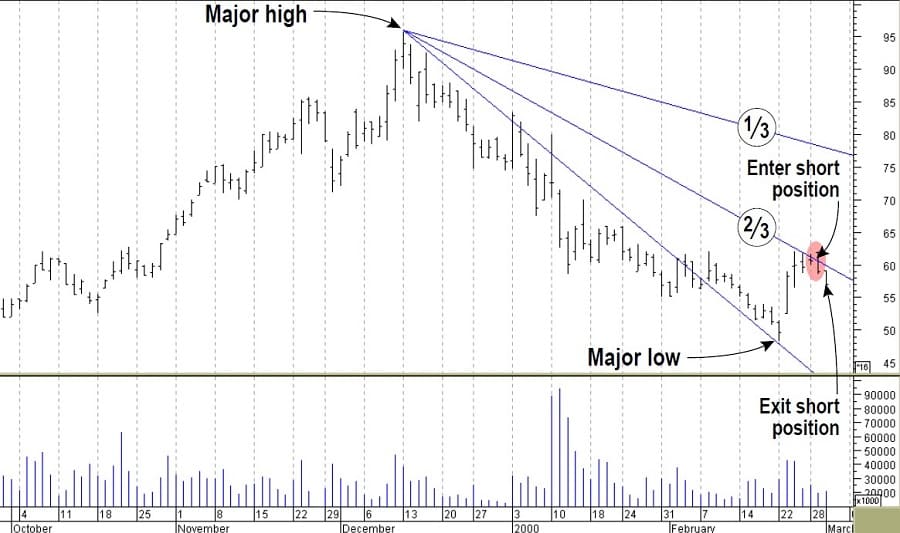
FIGURE 5: APPLYING SPEED LINES IN A DOWNTREND. Using speed resistance lines in a downtrend indicated that the upward price action in America Online [AOL] was not a trend reversal.
On February 28, 2000, I noticed that although prices tried to go above the two-thirds line, there was enough resistance to prevent that from happening. The following day, prices opened above the two-thirds line but closed well below it. Instead of going long, I entered a short position at 60 on February 29, 2000, and covered it on March 1, 2000, for a three-point gain.
CONCLUSION
Speed resistance lines work best for securities that show strong trends. If you are considering entering a long position in a security that looks as if it is rebounding from a downtrend, identify the major high and low, insert the speed resistance lines, and study the price action at the two-thirds line. If there is enough resistance to stop prices from breaking above this line, do not enter long positions. Only when prices close above this line for two consecutive days should you enter your long positions. If prices seem to decline from or close to this line, you might consider entering short positions.
Similar principles apply to securities that have been in a strong positive trend. Price action at the first retracement level can help in making a decision to enter long or short positions. Speed resistance lines are good benchmarks to use in determining whether a market is correcting or reversing. They are helpful tools that can expose several profitable trading opportunities.

