Articles
Scientific Guide To Price Action and Pattern Trading: Wisdom of Trend, Cycle, and Fractal Wave

In this book, we want to deliver you the strong message on how beneficial the Price Action and Pattern Trading is in comparison to the technical indicators used last few decades. This book heavily focuses on tradable patterns in the financial market. The patterns include Fibonacci patterns, Elliott Wave patterns, Harmonic patterns, and many other price patterns for your trading. We share useful insight behind the financial market dynamics and price patterns from our computerized research. We have put numerous trading strategies under five categories (i.e. five regularities) to make your life simpler.
We present the systematic view on market dynamics and price patterns to improve your knowledge in your financial trading. Most importantly, this book will help you to understand trend, cycle, and fractal wave. You will learn how to attach them to your trading strategy. After this book, you will be able to use the wisdom of trend, cycle and fractal wave at your advantage for your trading. At the latter part of this book, we also provide some useful information towards your trading management. We provide practical knowledge on risk management and portfolio management. You might need the Peak Trough Analysis tool to follow some of the chapters in this book. You can freely download the Peak Trough Analysis tool from the Publisher’s website. Finally, reader should note that this book contains some strong technical language. We hope you to get the full benefits from many brand new knowledge introduced in this book for your financial trading.

| Pages | 523 |
| Format | |
| Publication Date | 2020 |
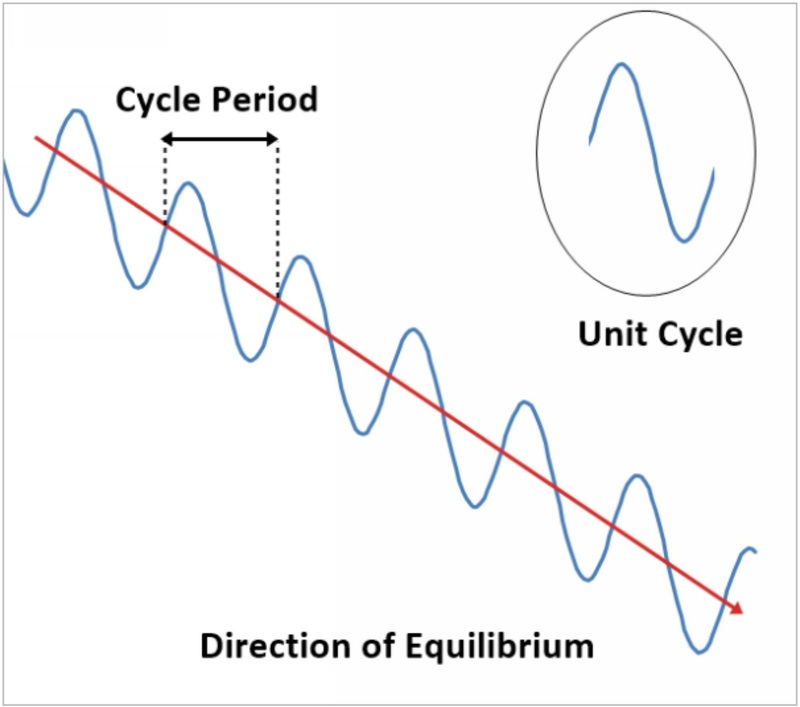
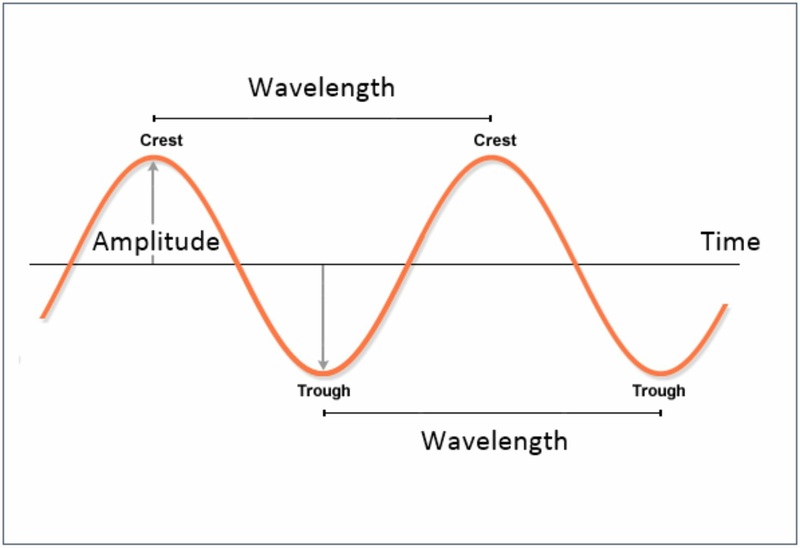
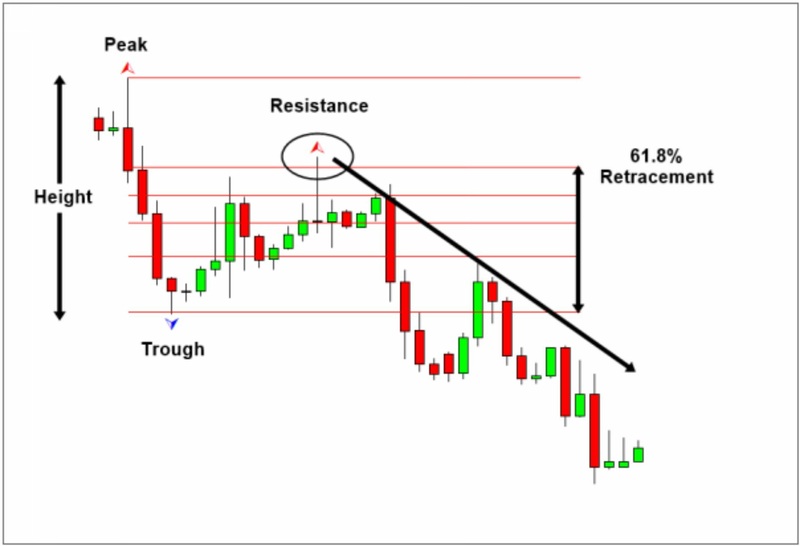
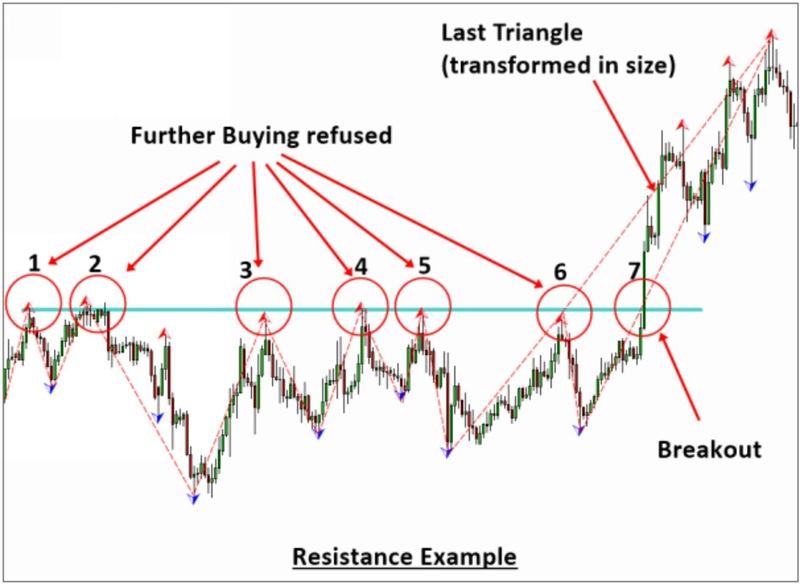
Some Pictures From the Book
Table of Contents:
Introduction to Five Regularities in the Financial Market
- 1. Introduction to Technical Analysis
- 2. Introduction to Charting Techniques
- 3. The Five Regularities in the Financial Market
- 4. Random Process
- 5. Stationary Process (No Trend)
- 6. Equilibrium Process (Trend)
- 7. Wave Process (Cycle)
- 8. Fractal-Wave Process
- 9. Equilibrium Wave Process (Trend and Cycle)
- 10. Equilibrium Fractal-Wave Process (Trend and Fractal Wave)
- 11. Choice of Trading Strategy and Price Patterns
- 12. Peak Trough Transformation to Visualize Equilibrium Fractal Wave
- 13. Using Equilibrium Fractal Wave Index to Select Your Trading Strategy
- 14. Appendix-Equilibrium Fractal Wave Derived Patterns
- 15. Appendix-Fractal Dimension Index for Financial Market
- 16. Appendix-General
- 17. References
Price Action and Pattern Trading (Overview on Practical Trading with the Fifth Regularity)
- 1. Fibonacci Retracement and Expansion Patterns
- 2. Support and Resistance
- 2.1 Horizontal Support and Resistance
- 2.2 Diagonal Support and Resistance
- 2.3 Identification of Support and Resistance with the Template and Pattern Approach
- 3. Trading with Equilibrium Fractal Wave
- 3.1 Introduction to EFW Index for trading
- 3.2 Trading with the Shape ratio of Equilibrium Fractal Wave
- 3.3 Introduction to Equilibrium Fractal Wave (EFW) Channel
- 3.4 Practical Trading with Equilibrium Fractal Wave (EFW) Channel
- 3.5 Superimposed Equilibrium Fractal Waves
- 3.6 Combining the Shape Ratio Trading and (EFW) Channel
- 4. Harmonic Pattern
- 4.1 Introduction to Harmonic Pattern
- 4.2 Harmonic Pattern Trading
- 4.3 Pattern Completion Interval (PCI)
- 4.4 Potential Reversal Zone (PRZ)
- 4.5 Potential Continuation Zone (PCZ)
- 4.6 Practical Trading with Harmonic Patterns
- 5. Elliott Wave Trading
- 5.1 Introduction to the Wave Principle
- 5.2 Scientific Wave Counting with the Template and Pattern Approach
- 5.3 Impulse Wave Structural Score and Corrective Wave Structural Score
- 5.4 Channelling Techniques
- 6. Triangle and Wedge Patterns
- 6.1 Introduction to Triangle and Wedge patterns
- 6.2 Classic Perspective of Triangle and Wedge Patterns
- 6.3 Diagonal Support and Resistance Perspective of Triangle and Wedge Pattern
- 6.4 Elliott Wave Perspective of Triangle and Wedge Pattern
- 7. References
Trading Management
- 1. Risk Management
- 1.1 Various Risks in Trading and Investment
- 1.2 Position Sizing Techniques
- 1.3 Reward/Risk Ratio in your trading
- 1.4 Breakeven Success Rate
- 1.5 Know Your Profit Goal Before Your Trading
- 1.6 Compounding Profits
- 1.7 Trading Performance and Cost Metrics
- 2. Portfolio Management
- 2.1 Combining Different Trading Strategy
- 2.2 Hedging
- 2.3 Portfolio Diversification
- 3. References
X3 Price Pattern for the Day Trader in the Financial Market
- 1. Price Patterns in the Financial Market
- 1.1 Why Do We Need New Pattern Framework for day trading?
- 1.2 How the X3 Pattern Framework is different from other Approaches
- 1.3 Defining Price Patterns with Retracement and Expansion Ratio
- 1.4 Scientific Lag Notation for Retracement Ratio and Expansion Ratio
- 1.5 Closing Retracement Ratio to Describe the Structure of Pattern
- 1.6 Factored Expansion Ratio to Describe Structure of Pattern
- 1.7 Converting Number of Points to Number of Triangles
- 2. Pattern Notation with Name, Structure, and Ideal Ratios
- 2.1 Pattern with 1 Triangle (3 points) Examples
- 2.2 Pattern with 2 Triangles (4 points) Examples
- 2.3 Pattern with 3 Triangles (5 points) Examples
- 2.4 Pattern with 4 Triangles (6 points) Examples
- 2.5 Pattern with 7 Triangles (9 points) Examples
- 3. Tutorial with Peak Trough Analysis
- 3.1 Loading Peak Trough Analysis indicator to Your Chart
- 3.2 Working with Fibonacci Retracement in Your Chart
- 3.3 Working with Fibonacci Expansion in Your Chart
- 4. Tutorial with X3 Price Pattern in Excel Spreadsheet
- 4.1 Calculating the Fibonacci Retracement Ratio in Microsoft
- 4.2 Calculating the Fibonacci Expansion Ratio in Apple
- 4.3 Detecting AB=CD pattern in Facebook
- 5. Special Chapter: Algorithm and Prediction for Artificial Intelligence, Time Series Forecasting, and Technical Analysis
Scientific Guide To Price Action and Pattern Trading: Wisdom of Trend, Cycle, and Fractal Wave By Young Ho Seo

