Technical Analysis from A to Z By Steven B. Achelis
21.20 $
| Author |
Steven B. Achelis |
|---|---|
| Pages |
582 |
| Format |
eBook |
| File Type |
EPUB , |
Master Technical Analysis – Achelis’ 2nd Edition (PDF)
If you’re searching for a comprehensive, no-nonsense guide to understanding technical indicators, chart patterns, and market analysis tools, Technical Analysis from A to Z by Steven B. Achelis (2nd Edition PDF) is your go-to resource. Widely recognized as one of the most practical and beginner-friendly books on the subject, this all-in-one reference decodes over 100 key technical indicators and charting tools—from Accumulation/Distribution to Zig Zag.
Now in its fully updated Second Edition, this classic text presents each indicator with clear definitions, formulas, interpretations, and real-world examples. Whether you’re a new trader looking to build a strong foundation or a seasoned investor aiming to refresh your technical toolkit, this book offers a structured and reliable approach to navigating the financial markets.
What sets this book apart is its simplicity without sacrificing depth. Achelis explains complex tools like MACD, RSI, Bollinger Bands, and Fibonacci retracements in plain English, making it a favorite among self-taught traders and analysts worldwide. This downloadable Technical Analysis from A to Z PDF gives you immediate access to the most essential knowledge in modern chart-based trading.
What You’ll Learn
- The purpose, formula, and interpretation of 100+ technical indicators
- How to read and apply chart patterns effectively
- Why trends, volume, and support/resistance levels matter
- How to identify confirmation and divergence signals
- The behavioral and emotional roots behind price movement
- How to use technical tools in real-world trading environments
Key Benefits
- Fully updated 2nd Edition PDF for modern trading platforms
- Concise definitions, formulas, and practical examples for each indicator
- Acts as both a learning tool and long-term reference guide
- Great for self-learners, chart enthusiasts, and system builders
- Based on the timeless principles of Dow Theory
- Instant digital delivery—no waiting or shipping fees
Who This Book Is For
- Beginner traders looking for a one-stop guide to technical indicators
- Intermediate chartists seeking a dependable reference manual
- Investors who want to better time entries and exits
- Analysts building indicator-based trading systems
- Anyone overwhelmed by too many tools and needs clarity and structure
What Is Technical Analysis Really About?
Ever found yourself wondering, “Should I buy today? What will prices look like next week or next year?” If only investing came with a crystal ball. The truth is, technical analysis doesn’t promise precise predictions—but it does give you the tools to make smarter, more informed trading decisions.
That’s where Technical Analysis from A to Z by Steven B. Achelis shines. This book isn’t about magic signals or secret formulas—it’s about understanding price behavior through structured observation. And that’s the real power behind technical analysis.
A Brief History Behind the Method
While the term “technical analysis” might sound intimidating, it’s built on a simple foundation: studying past price movements to make better investment choices. And the primary tool? Charts.
Modern-day technical analysis has deep roots in the Dow Theory, developed by Charles Dow around the early 1900s. This foundational theory introduced concepts that are still relevant today, like trend direction, support and resistance, confirmation and divergence, and volume behavior.
It’s no coincidence that the Dow Jones Industrial Average became one of the world’s most watched indicators. Dow’s contribution laid the groundwork for technical analysis as we know it today.
The Human Factor in Market Behavior
One of the most important ideas in Achelis’ book—and in technical analysis as a whole—is understanding that markets are made of people. Every price point reflects a consensus: someone’s willing to buy, someone else is ready to sell. And behind each of those decisions lie human emotions and expectations.
That’s where things get tricky. Human behavior isn’t always logical or measurable. Expectations are influenced by news, emotions, personal experiences, social factors, and even traffic jams or last week’s salary slip. Whether it’s hedge fund managers or first-time investors, the market is a mix of perspectives, goals, and reactions. And this human unpredictability is exactly what gives technical analysis its edge. Instead of fighting it, the best traders learn to interpret it through charts.
Why This Book Matters for Traders
What makes Technical Analysis from A to Z (2nd Edition PDF) so valuable is that it teaches you to analyze the “what” instead of guessing the “why.” Rather than chasing predictions, it trains your eyes to recognize patterns, trends, and price structures that repeat, because while humans are unpredictable, they’re also habitual.
By reading this book, you won’t just learn definitions of technical indicators—you’ll start seeing the market differently. From MACD to Bollinger Bands, volume spikes to breakouts, Achelis gives you a complete reference to the technical side of trading, with clarity and without fluff.
Some Pictures From the Book
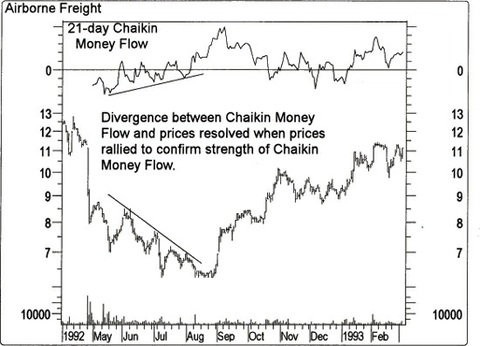
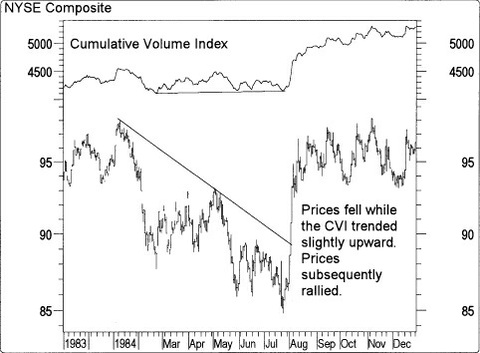
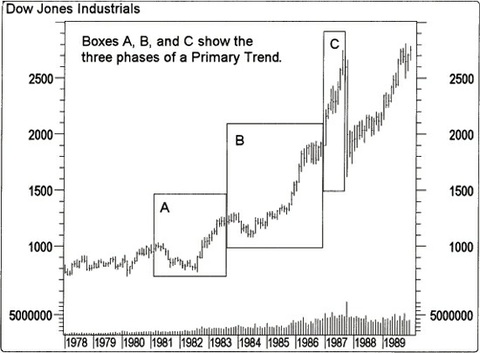
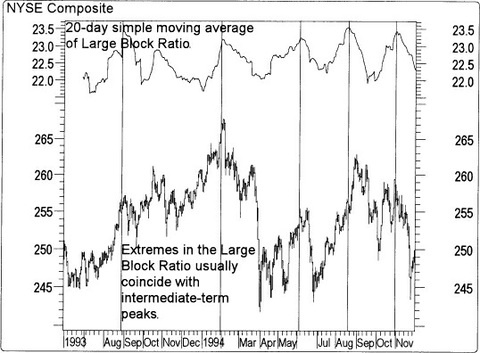
Table of Contents:
PART ONE: INTRODUCTION TO TECHNICAL ANALYSIS:
- TECHNICAL ANALYSIS
- PRICE FIELDS
- CHARTS
- PERIODICITY
- THE TIME ELEMENT
- SUPPORT AND RESISTANCE
- TRENDS
- MOVING AVERAGES
- INDICATORS
- MARKET INDICATORS
- LINE STUDIES
- A SAMPLE APPROACH
- CONCLUSION
PART TWO: REFERENCE:
- ABSOLUTE BREADTH INDEX
- ACCUMULATION/DISTRIBUTION LINE
- ACCUMULATION SWING INDEX
- ADVANCE/DECLINE LINE
- ADVANCE/DECLINE RATIO
- ADVANCING-DECLINING ISSUES
- ADVANCING, DECLINING, UNCHANGED VOLUME
- ANDREWS’S PITCHFORK
- ARMS INDEX (TRIN)
- AROON
- AVERAGE TRUE RANGE
- BOLLINGER BANDS
- BREADTH THRUST
- BULL/BEAR RATIO
- CANDLESTICKS, JAPANESE
- CANSLIM
- CHAIKIN MONEY FLOW
- CHAIKIN OSCILLATOR
- CHANDE MOMENTUM OSCILLATOR
- COMMODITY CHANNEL INDEX
- COMMODITY SELECTION INDEX
- CORRELATION ANALYSIS
- CUMULATIVE VOLUME INDEX
- CYCLES
- DEMAND INDEX
- DETRENDED PRICE OSCILLATOR
- DIRECTIONAL MOVEMENT
- DOUBLE EXPONENTIAL MOVING AVERAGE
- DOW THEORY
- DYNAMIC MOMENTUM INDEX
- EASE OF MOVEMENT
- EFFICIENT MARKET THEORY
- ELLIOTT WAVE THEORY
- ENVELOPES (TRADING BANDS)
- EQUIVOLUME
- FIBONACCI STUDIES
- FORECAST OSCILLATOR
- FOUR PERCENT MODEL
- FOURIER TRANSFORM
- FUNDAMENTAL ANALYSIS
- GANN ANGLES
- HERRICK PAYOFF INDEX
- INERTIA
- INTEREST RATES
- INTRADAY MOMENTUM INDEX
- KAGI
- KLINGER OSCILLATOR
- LARGE BLOCK RATIO
- LINEAR REGRESSION INDICATOR
- LINEAR REGRESSION SLOPE
- LINEAR REGRESSION TRENDLINES
- MARKET FACILITATION INDEX
- MASS INDEX
- McCLELLAN OSCILLATOR
- McCLELLAN SUMMATION INDEX
- MEDIAN PRICE
- MEMBER SHORT RATIO
- MESA SINE WAVE
- MOMENTUM
- MONEY FLOW INDEX
- MOVING AVERAGE CONVERGENCE/DIVERGENCE
- MOVING AVERAGES
- NEGATIVE VOLUME INDEX
- NEW HIGHS-LOWS CUMULATIVE
- NEW HIGHS/LOWS RATIO
- NEW HIGHS-NEW LOWS
- ODD LOT BALANCE INDEX
- PUBLIC SHORT RATIO
- PUTS/CALLS RATIO
- QSTICK
- QUADRANT LINES
- R-SQUARED
- RAFF REGRESSION CHANNEL
- RANDOM WALK INDEX
- RANGE INDICATOR
- RECTANGLE
- RELATIVE MOMENTUM INDEX
- RELATIVE STRENGTH, COMPARATIVE
- RELATIVE STRENGTH INDEX
- RELATIVE VOLATILITY INDEX
- RENKO
- SPEED RESISTANCE LINES
- SPREADS
- STANDARD DEVIATION
- STANDARD DEVIATION CHANNEL
- STANDARD ERROR
- STANDARD ERROR BANDS
- STANDARD ERROR CHANNEL
- STIX
- STOCHASTIC MOMENTUM INDEX
- STOCHASTIC OSCILLATOR
- SWING INDEX
- TEMA
- THREE LINE BREAK
- TIME SERIES FORECAST
- TIRONE LEVELS
- TOTAL SHORT RATIO
- TRADE VOLUME INDEX
- TRENDLINES
- TRIX
- TYPICAL PRICE
- ULTIMATE OSCILLATOR
- UPSIDE/DOWNSIDE RATIO
- UPSIDE/DOWNSIDE VOLUME
- VERTICAL HORIZONTAL FILTER
- VOLATILITY, CHAIKIN’S
- VOLUME
- VOLUME OSCILLATOR
- VOLUME RATE-OF-CHANGE
- WEIGHTED CLOSE
- WILDER’S SMOOTHING
- WILLIAMS’S ACCUMULATION/DISTRIBUTION
- WILLIAMS’S %R
- ZIG ZAG
Technical Analysis from A to Z By Steven B. Achelis