Scientific Guide To Price Action and Pattern Trading: Wisdom of Trend, Cycle, and Fractal Wave By Young Ho Seo
9.99 $
| Author |
Young Ho Seo |
|---|---|
| Pages |
523 |
| Format |
eBook |
| File Type |
|
Discover the Power of Price Action and Pattern Trading
Scientific Guide to Price Action and Pattern Trading isn’t just another trading manual—it’s a comprehensive, research-backed playbook for traders aiming to improve market timing, strategy development, and execution. This guide is packed with trading strategies grounded in real price behavior. It goes beyond traditional indicators by revealing the mechanics behind market movement using pure price action and high-probability pattern recognition.
Whether you’re struggling with market structure, or looking to systematize your strategy, this guide offers a proven roadmap. Backed by advanced computational research, it dives deep into Fibonacci sequences, Elliott Waves, Harmonic structures, and the science of fractal wave analysis—giving you a clear framework to make smarter trades.
Ideal for intermediate to advanced traders, Scientific Guide to Price Action and Pattern Trading combines deep theory with real-world application, including risk and portfolio management strategies for long-term success.
What sets this guide apart is its structured framework. Rather than presenting scattered techniques, it organizes all content into five clearly defined strategy categories, helping traders cut through the noise and focus on what works.
Beyond pattern recognition, the book covers trend, cycle, and fractal wave theory in depth—giving traders a richer understanding of market structure. You’ll learn how to integrate these core elements into your trading plan and recognize the fractal nature of price across timeframes.
The guide also includes practical instruction in risk management and portfolio construction—crucial tools for long-term success. Some chapters incorporate the Peak Trough Analysis tool, available for free on the publisher’s website.
While this is an advanced book intended for traders already familiar with technical concepts, it offers tremendous value: a complete system for trading with precision, structure, and confidence. Whether you’re sharpening your edge or building a trading model from scratch, this guide delivers the insights and tools you need to thrive in today’s markets.
Preview Images from the Scientific Guide to Price Action
Price Action & Pattern Trading – Chapter Overview
Introduction to Five Regularities in the Financial Market
- 1. Introduction to Technical Analysis
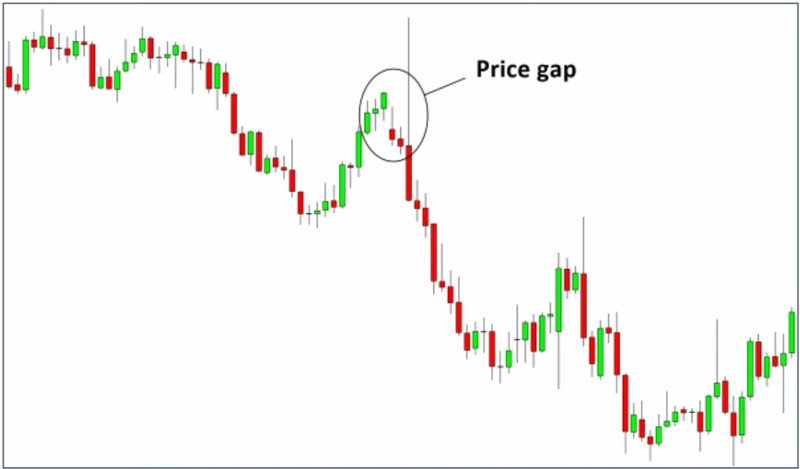
- 2. Introduction to Charting Techniques
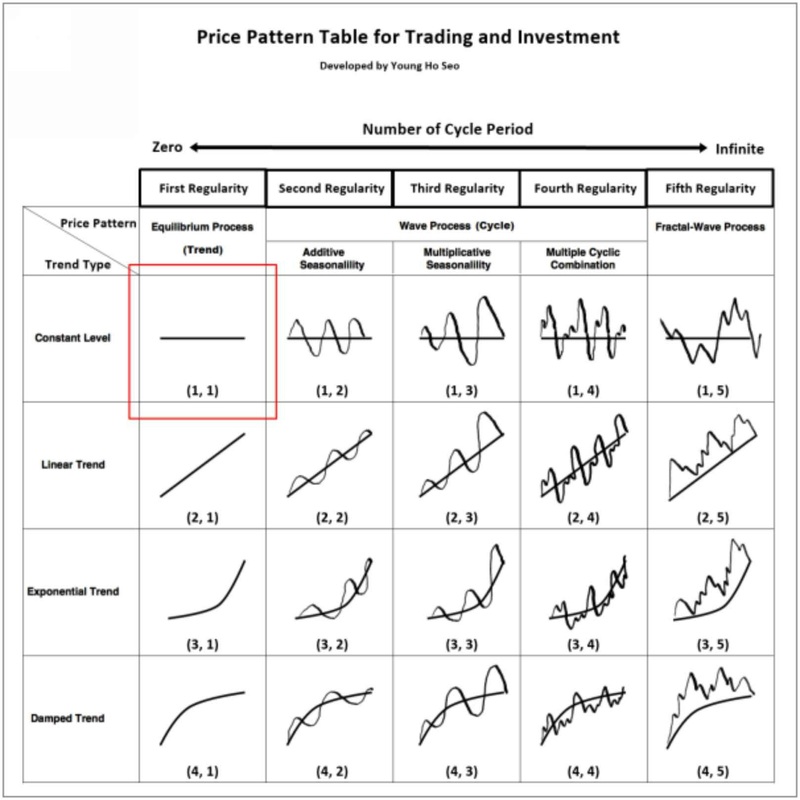
- 3. The Five Regularities in the Financial Market
- 4. Random Process
- 5. Stationary Process (No Trend)
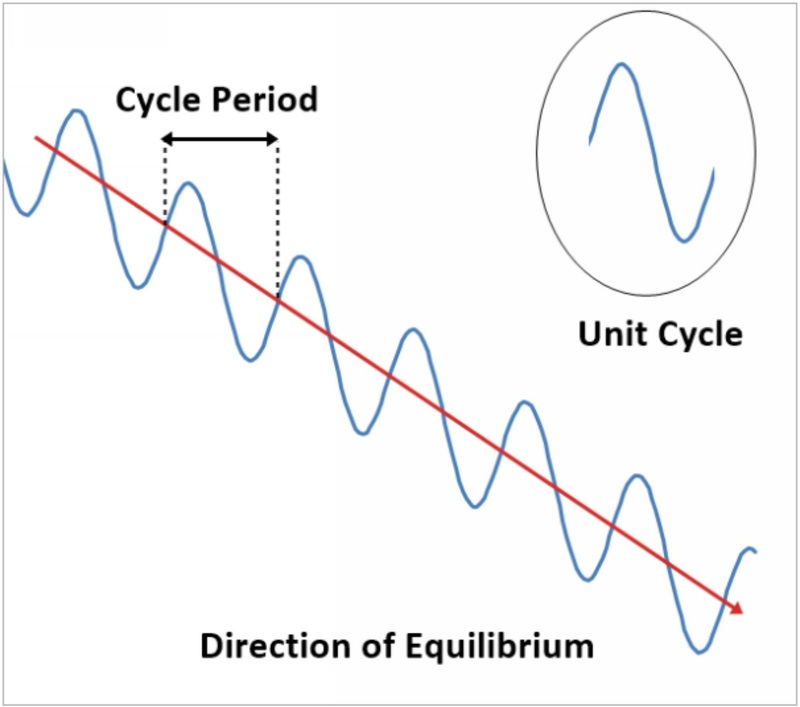
- 6. Equilibrium Process (Trend)
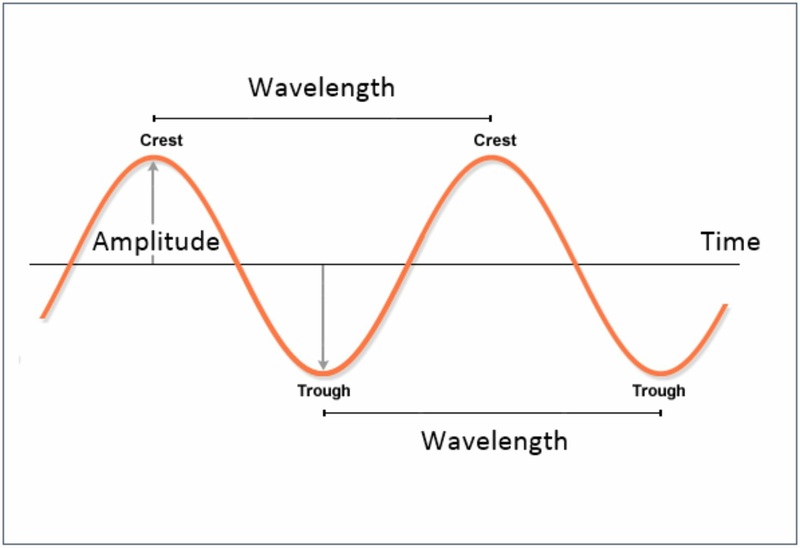
- 7. Wave Process (Cycle)
- 8. Fractal-Wave Process
- 9. Equilibrium Wave Process (Trend and Cycle)
- 10. Equilibrium Fractal-Wave Process (Trend and Fractal Wave)
- 11. Choice of Trading Strategy and Price Patterns
- 12. Peak Trough Transformation to Visualize Equilibrium Fractal Wave
- 13. Using Equilibrium Fractal Wave Index to Select Your Trading Strategy
- 14. Appendix-Equilibrium Fractal Wave Derived Patterns
- 15. Appendix-Fractal Dimension Index for Financial Market
- 16. Appendix-General
- 17. References
Price Action and Pattern Trading (Overview on Practical Trading with the Fifth Regularity)
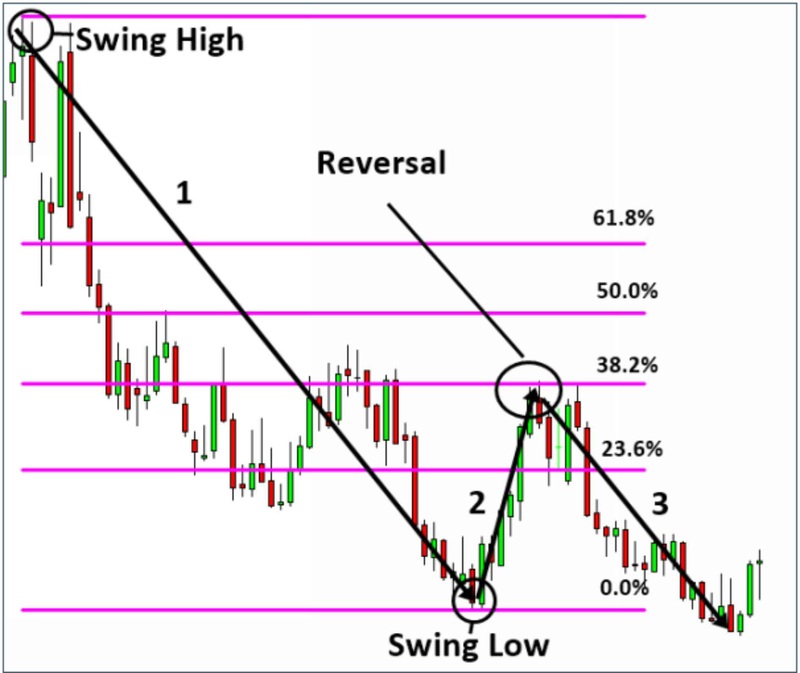
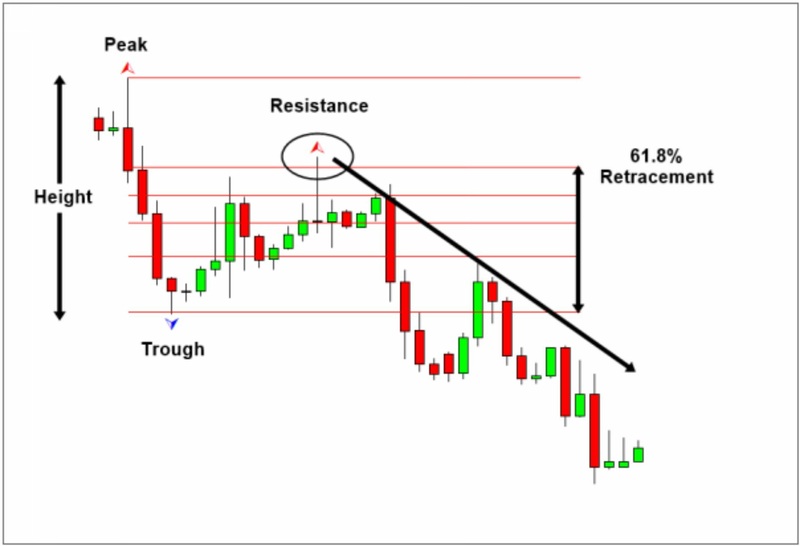
- 1. Fibonacci Retracement and Expansion Patterns
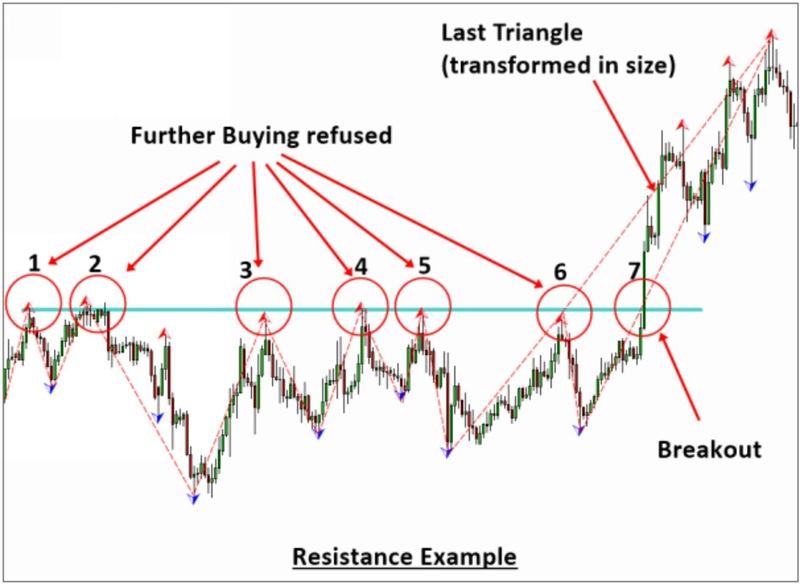
- 2. Support and Resistance
- 2.1 Horizontal Support and Resistance
- 2.2 Diagonal Support and Resistance
- 2.3 Identification of Support and Resistance with the Template and Pattern Approach
- 3. Trading with Equilibrium Fractal Wave
- 3.1 Introduction to EFW Index for trading
- 3.2 Trading with the Shape ratio of Equilibrium Fractal Wave
- 3.3 Introduction to Equilibrium Fractal Wave (EFW) Channel
- 3.4 Practical Trading with Equilibrium Fractal Wave (EFW) Channel
- 3.5 Superimposed Equilibrium Fractal Waves
- 3.6 Combining the Shape Ratio Trading and (EFW) Channel
- 4. Harmonic Pattern
- 4.1 Introduction to Harmonic Pattern
- 4.2 Harmonic Pattern Trading
- 4.3 Pattern Completion Interval (PCI)
- 4.4 Potential Reversal Zone (PRZ)
- 4.5 Potential Continuation Zone (PCZ)
- 4.6 Practical Trading with Harmonic Patterns
- 5. Elliott Wave Trading
- 5.1 Introduction to the Wave Principle
- 5.2 Scientific Wave Counting with the Template and Pattern Approach
- 5.3 Impulse Wave Structural Score and Corrective Wave Structural Score
- 5.4 Channelling Techniques
- 6. Triangle and Wedge Patterns
- 6.1 Introduction to Triangle and Wedge patterns
- 6.2 Classic Perspective of Triangle and Wedge Patterns
- 6.3 Diagonal Support and Resistance Perspective of Triangle and Wedge Pattern
- 6.4 Elliott Wave Perspective of Triangle and Wedge Pattern
- 7. References
Trading Management
- 1. Risk Management
- 1.1 Various Risks in Trading and Investment
- 1.2 Position Sizing Techniques
- 1.3 Reward/Risk Ratio in your trading
- 1.4 Breakeven Success Rate
- 1.5 Know Your Profit Goal Before Your Trading
- 1.6 Compounding Profits
- 1.7 Trading Performance and Cost Metrics
- 2. Portfolio Management
- 2.1 Combining Different Trading Strategy
- 2.2 Hedging
- 2.3 Portfolio Diversification
- 3. References
X3 Price Pattern for the Day Trader in the Financial Market
- 1. Price Patterns in the Financial Market
- 1.1 Why Do We Need New Pattern Framework for day trading?
- 1.2 How the X3 Pattern Framework is different from other Approaches
- 1.3 Defining Price Patterns with Retracement and Expansion Ratio
- 1.4 Scientific Lag Notation for Retracement Ratio and Expansion Ratio
- 1.5 Closing Retracement Ratio to Describe the Structure of Pattern
- 1.6 Factored Expansion Ratio to Describe Structure of Pattern
- 1.7 Converting Number of Points to Number of Triangles
- 2. Pattern Notation with Name, Structure, and Ideal Ratios
- 2.1 Pattern with 1 Triangle (3 points) Examples
- 2.2 Pattern with 2 Triangles (4 points) Examples
- 2.3 Pattern with 3 Triangles (5 points) Examples
- 2.4 Pattern with 4 Triangles (6 points) Examples
- 2.5 Pattern with 7 Triangles (9 points) Examples
- 3. Tutorial with Peak Trough Analysis
- 3.1 Loading Peak Trough Analysis indicator to Your Chart
- 3.2 Working with Fibonacci Retracement in Your Chart
- 3.3 Working with Fibonacci Expansion in Your Chart
- 4. Tutorial with X3 Price Pattern in Excel Spreadsheet
- 4.1 Calculating the Fibonacci Retracement Ratio in Microsoft
- 4.2 Calculating the Fibonacci Expansion Ratio in Apple
- 4.3 Detecting AB=CD pattern in Facebook
- 5. Special Chapter: Algorithm and Prediction for Artificial Intelligence, Time Series Forecasting, and Technical Analysis
Frequently Asked Questions About Young Ho Seo’s Price Action Guide
1. What is the main focus of this book?
The book focuses on price action and pattern trading strategies, including Fibonacci, Elliott Wave, Harmonic patterns, and fractal wave theory.
2. Is this book suitable for beginners in trading?
This is an advanced guide best suited for traders already familiar with technical analysis and market structure.
3. Does the book include practical trading strategies?
Yes, it offers a structured system with real-world strategies across five defined categories, backed by computational research.
4. Does this book include chart examples or visual content?
Yes, it includes visual tutorials and technical illustrations, including Peak Trough Analysis charts.
Scientific Guide To Price Action and Pattern Trading: Wisdom of Trend, Cycle, and Fractal Wave By Young Ho Seo