Articles
Pin Bars & Fibonacci – A Great Mix

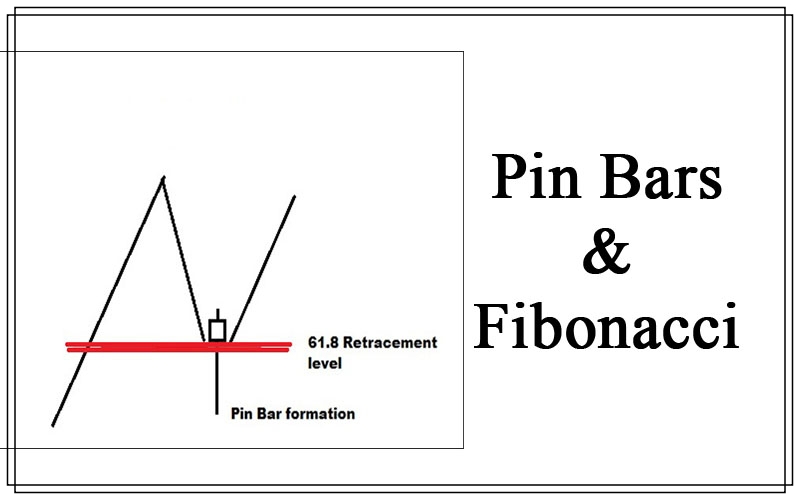
Every trader knows that Pin Bars are an excellent reversal pattern, strongly recommended when a correction within a primary trend is considered has formed and you are trading with trend. A Pin Bar certainly provides an important technical signal, but its validity is strengthened when it is carried out in a price area rich in support and resistance levels.
One of the methods often combined when using Pin Bars is the Fibonacci retracement tool.
The retracement was created by Leonardo Fibonacci in the 12th century. The Italian mathematician popularized a simple sequence of numbers, known as the “sequence of Fibonacci numbers.” The Fibonacci numbers are as follows: starting from 0 and 1, each number is the sum of the two previous numbers.
So after 0 and 1, the next number will be 1, then 2, then 3 and 5 … and so on.
These numbers have some unique properties. For example, two consecutive numbers in the sequence: 21 and 34. If we divide one for the other, 21/34, we get 0.618. If we choose any other two consecutive numbers, for example, 144 and 233, and divide one for the other, 144/233, we still obtain 0.618.
This particular ratio, 0.618 (or 61.8%) is known as the Golden Ratio.
Beyond 61.8%, there are other ratios in the Fibonacci sequence as 0.236, 0.382, 0.500 and 0.786, all obtained combining each sequence number to the others.
These ratios are frequently used by technical analysts to determine support levels (retracements) or significant resistance levels / targets (projections). In order to obtain this information, we will have to identify the bottom / top of the market from which we can start calculating the Fibonacci numbers.
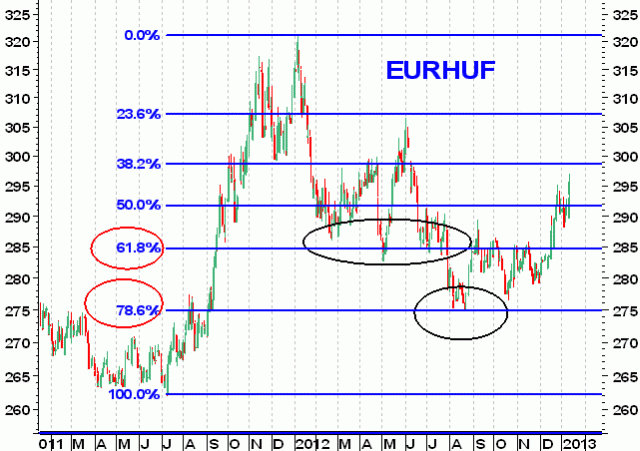
The following chart shows us the great utility of using Fibonacci retracements when a primary tendency undergoes a correction.

In the chart above, EurHuf has stopped its bullish run started at 262.10 in January 2012 at 315.80.
Since then, a correction has started and an insurmountable obstacle has been found in the 61.8% of retracement of 284.40 until August 2012.
After several attempts, the support has fallen, but again, a Fibonacci retracement, the 78.6% at 274.80 has contained the fall of EurHuf.
Thanks to the indications coming from the Fibonacci retracements, the trader has been able to interpret the critical moments of the market correctly.
If we had recorded any reversal pattern like Pin Bars at these levels, then the trader would have had an excellent weapon to enter long on EurHuf in the direction of the long term bullish trend, together with a low ratio of risk / efficiency.
Let’s see now a concrete example of how to combine the power of Pin Bars to Fibonacci retracements.
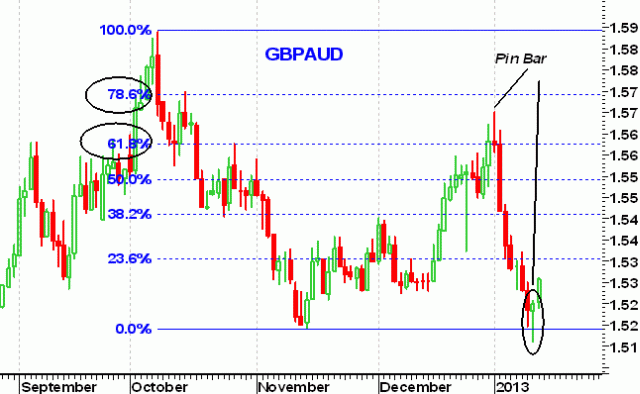
The chart below represents the GbpAud cross. As we can see on this chart, in October 2012 a correction occurred, started from 1.5891 and then ended in November at 1.5190. From that moment, another correction with the Fibonacci retracements from the top of 1.5891 to the bottom of 1.5190 started.
In December, the 38.2% contained every attempt of GbpAud to rise for several days, but, after the overcome of this resistance, the 61.8% retracement of 1.5630 acted as a barrier to the upside.
At the end of 2012, a double bullish break attempt happened, but always with closure next to the above mentioned 61.8%.
On January 2nd 2013, an intraday top occurred at 1.5702, but a Pin Bar was also formalized, a signal that we were waiting for to enter short on GbpAud.
After placing the short trade below the low of the Pin Bar at 1.5606 with stop at a few pips above the high of 1.5702, waiting for the next day to see the disruptive bears awakening was enough. This enabled the trader to get a good profit.
Even in this case, the signal of the Pin Bar registered in proximity of a Fibonacci retracement key level such as 61.8%, proved to be a powerful force.

For more information on how to trade pin bars, price action and fibonacci retracements, make sure to check out the Price Action Course where you will learn rule based systems to trade pin bars and price action using high probability setups.
