Articles
Pick Out Your Trading Trend

There are three kinds of trends: short, intermediate, and long term. This veteran trader and analyst explains how you can spot them and use them.
Intro:
Technical analysis assumes that all the knowledge, hopes, and fears of both active and inactive market participants are reflected in one thing: the price. Even if I am in a cash position, I am still influencing the price because it would be higher if my cash were invested. Thus, prices are determined by psychology. This would just be an interesting observation, except that psychology moves in trends, and so do prices.
Most of the technical tools we use are aimed at identifying trend reversals at an early stage. We ride on trends until the weight of the evidence shows or proves that the trend has reversed — in this case, the number of reliable technical indicators all pointing in the same direction. Hence, the greater the number of indicators signaling a reversal, the greater the probability that a reversal will take place. It is important to remember that technical analysis only deals in probabilities, never certainties. Unfortunately, there is no known method of forecasting the dura-tion and magnitude of a trend with any degree of consistency. Identifying reversals is hard enough. What is a trend? How long do they last? Before the advent of intraday charts, there were three generally accepted durations — primary, intermediate, and short-term. The main or primary trend (Figure 1) is often referred to as a bull or bear market.
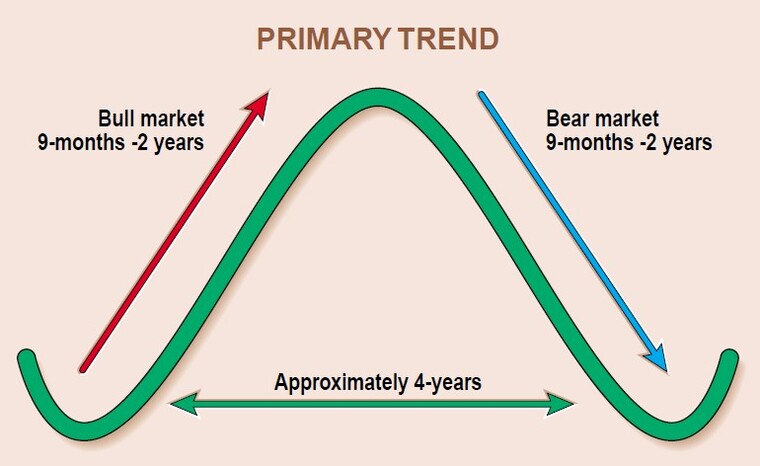
FIGURE 1: PRIMARY TREND. The classic four-year trend is broken almost equally into bull and bear modes.
Bulls go up and bears go down. Typically, they last from about nine months to two years, while the bear market troughs are separated by just under four years. These trends revolve around the business cycle and tend to repeat. This is true whether the weak phase of the cycle is an actual recession or there is no recession or growth. A fourth category, the secular trend, embraces several primary trends and lasts between 10 and 25 years. An example using US bond yields between the 1930s and the 1990s can be seen in Figure 2.
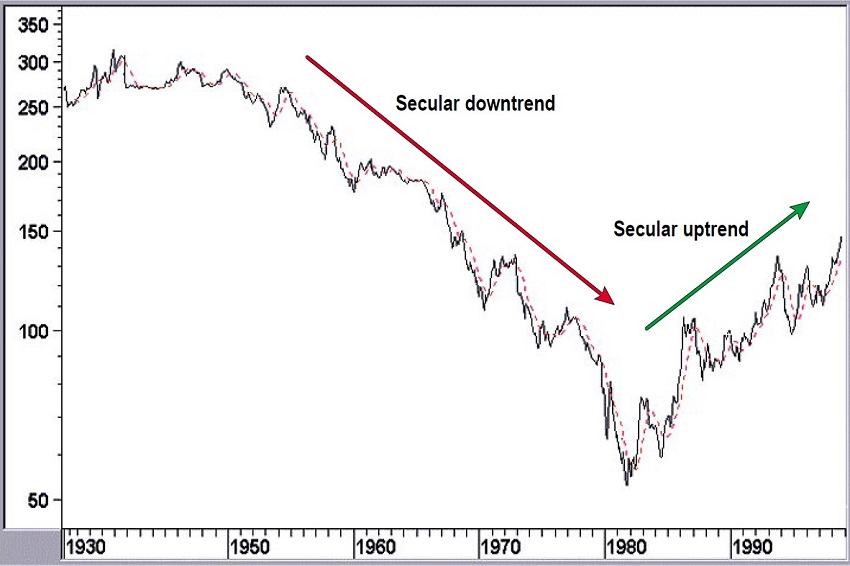
FIGURE 2: SECULAR BOND TRENDS. In 1982, the downtrend in bond prices broke along with inflation, setting off the greatest stock bull market in history.
Primary trends are not straight-line affairs, but consist of a series of rallies and reactions. Those rallies and reactions are known as intermediate trends and are represented in Figure 3 by the solid blue line. They can vary in length from as little as six weeks to as much as nine months — the length of a very short primary trend. Intermediate trends typically develop as a result of changing perceptions concerning economic, financial, or political events.
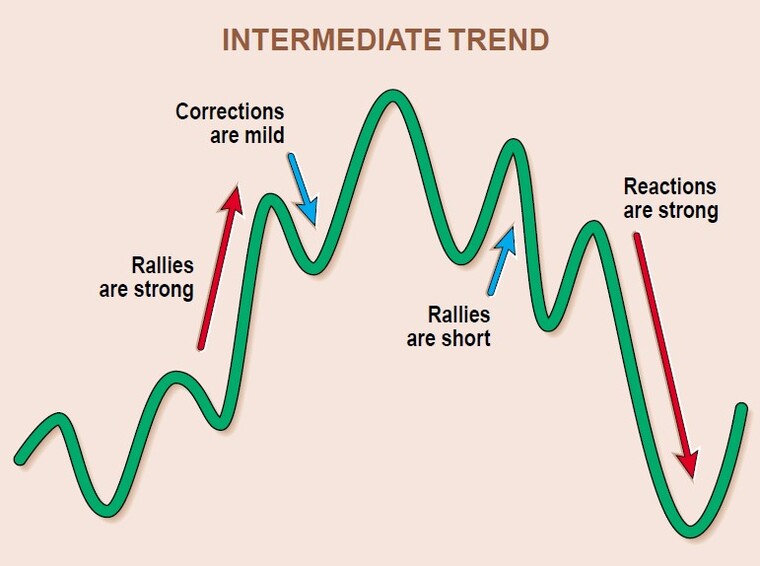
FIGURE 3: INTERMEDIATE TREND. Pulsating in the midst of primary trends are shorter, intermediate trends, giving charts a stairstep appearance.
It is important to have some understanding about the direction of the main or primary trend. This is because rallies in bull markets are strong and reactions weak, as shown in Figure 3. On the other hand, bear market reactions are strong while rallies are short, sharp, and generally unpredictable. If you have a fix on the underlying primary trend, then you will be better prepared for the nature of the intermediate rallies and reactions that will unfold.
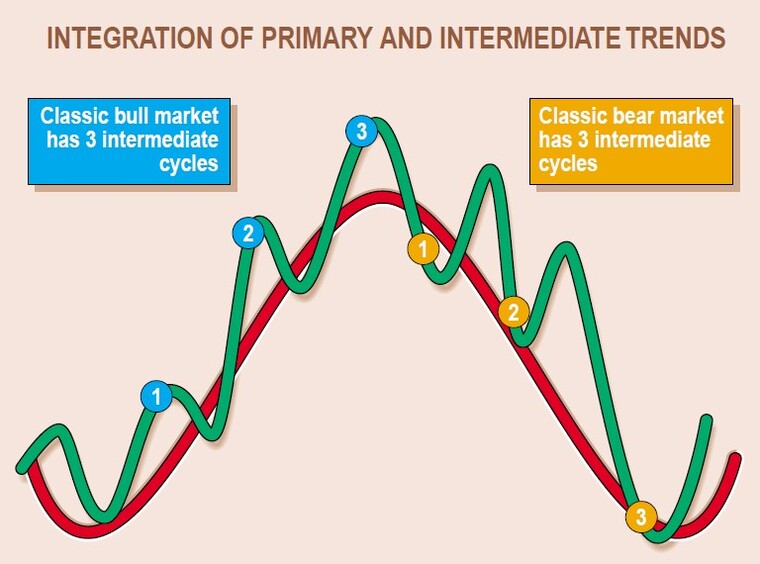
FIGURE 4: THREE INTERMEDIATE CYCLES. An idealized market cycle would have three waves up and three waves down.
Classic technical theory holds that each bull market contains three intermediate cycles, as does each primary bear market (Figure 4). I would use this only as a guide, since many primary trends are not easily classified this way. Thus, if you are waiting for that third intermediate cycle in a bull market, it may never materialize. In turn, intermediate trends can be broken down into short-term trends that last from as little as two weeks to as much as five or six weeks. They can be seen in Figure 5, represented by the dashed red lines.
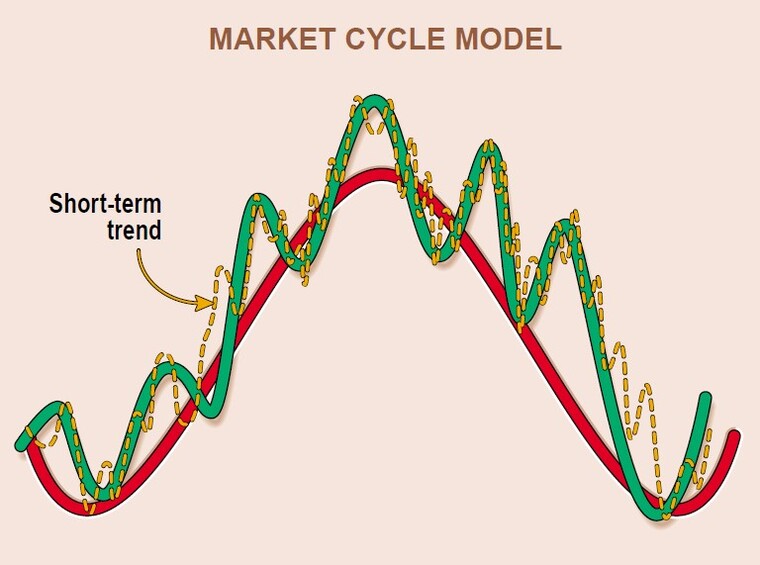
FIGURE 5: MARKET CYCLE MODEL. Inside the intermediate cycles are short-term cycles that last from two to six weeks.
THE MARKET CYCLE MODEL
Now that all three trends have been discussed, a couple of points are worth making. First, as an investor, it is best to accumulate when the primary trend is in the early stages of reversing from down to up and liquidating when the trend is reversing in the opposite direction (Figure 6).
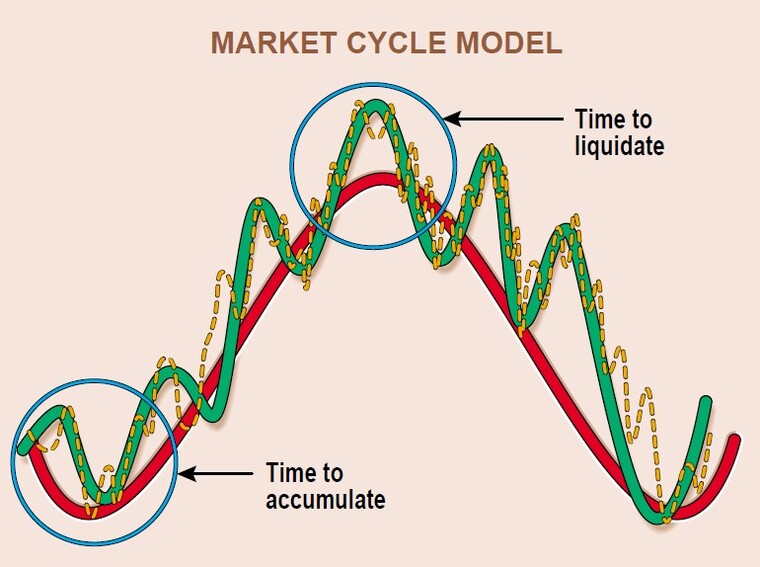
FIGURE 6: ACCUMULATE/DISTRIBUTE. Naturally, the best time to load up on stocks is when a cycle bottom is at hand. Approaching the top, it’s time to distribute your holdings.
Second, as traders, we are better off if we position ourselves from the long side in a bull market, since that is the time when short-term trends tend to have the greatest magnitude. By the same token, it does not usually pay to short in a bull market because declines can be quite brief and reversals to the upside unexpectedly sharp. If you are going to make a mistake, it is more likely to come from a countercyclical trade (Figure 7). This is where the market cycle model comes into play.
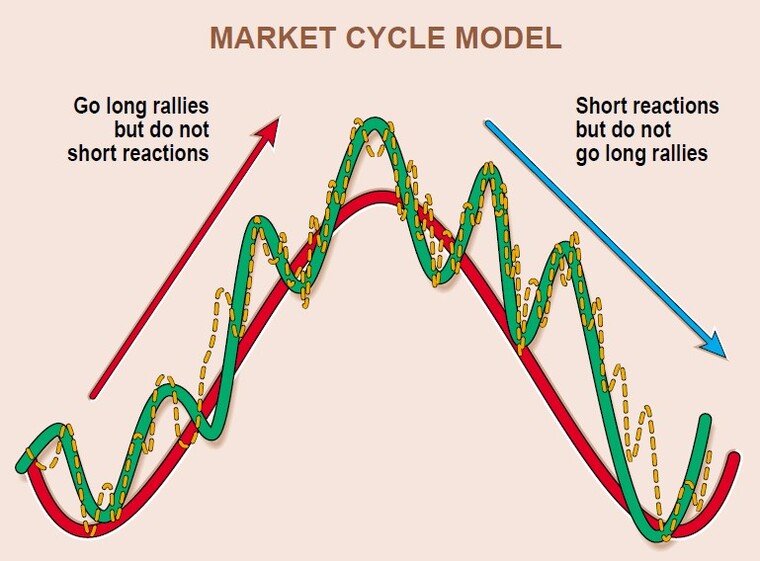
FIGURE 7: DON’T FIGHT THE TREND. When trading in and out during a primary trend, go in the direction of the primary trend, not against it.
USING THE MARKET CYCLE MODEL
How can you put this into practice? My favorite method is to plot three smoothed momentum indicators to mimic the three trends. An example can be seen in Figure 8 using the KST indicator, originally introduced in the early 1990s. The formulas for the three trends can be seen in the sidebar, “The KST.”
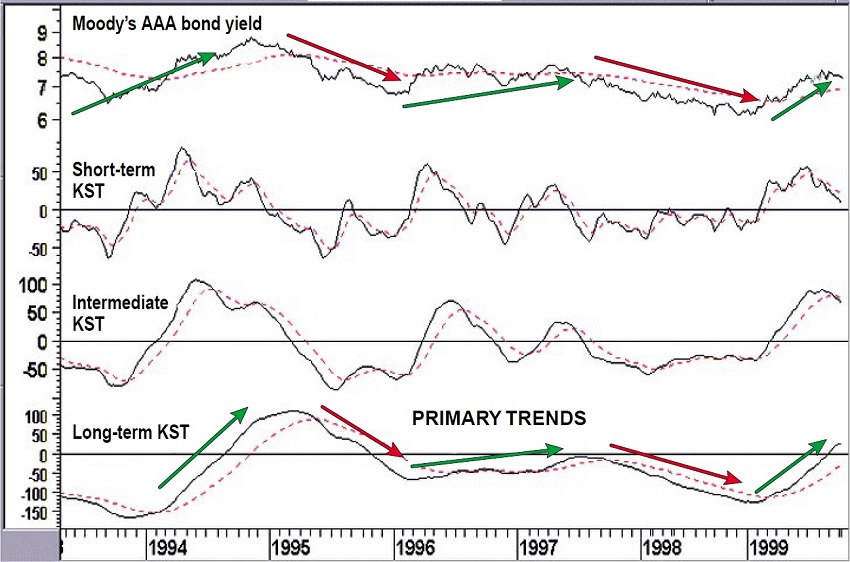
FIGURE 8: KST. This indicator, developed by Pring in the early 1990s, is generally reliable in picking out trends.
It’s also possible to substitute other smoothed momentum indicators. For example, three suggested sets of parameters are displayed in Figure 9 for the stochastic indicator. This arrangement is far from perfect, but it does provide a framework that offers the trader and investor a road map of the current convergence of the short-, intermediate-, and long-term trends. As always, it is important to ensure that other indicators in the technical toolbox also support this type of analysis.
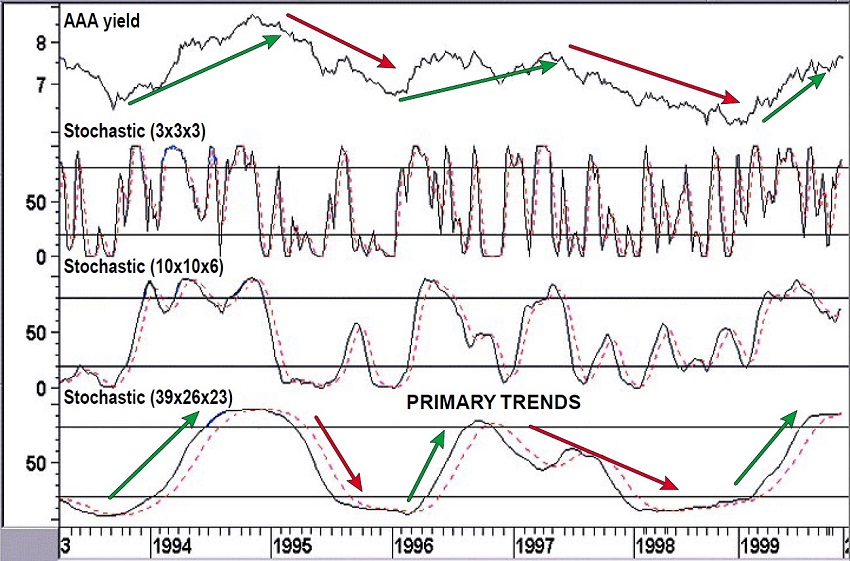
FIGURE 9: STOCHASTIC SMOOTHING. Stochastics of differing-length parameters also pick up trends. You can smooth with any of a variety of momentum indicators.
This market cycle model approach can be applied to intraday analysis. Obviously, the time frames will differ radically from the primary, intermediate, and short-term varieties we looked at previously, but the principle still applies. If you know that a powerful three- to four-day rally is under way, it would be madness to short a four-hour countercyclical move. Clearly, trading from the long side would be more appropriate, but you would only know this if you had identified the bullish intraday primary trend in the first place. I will cover these shorter-term aspects in another article.
IN SUMMARY
There are three generally accepted trends: short-, intermediate-, and long-term or primary. Secular, or very long-term, trends also make up several primary trends and can last between 10 and 25 years. At the other end of the spectrum, intraday data now provides us with trends of even shorter time spans lasting as little as 10 to 15 minutes.
It is important for investors to have some idea of the direction and maturity of the main trend. Working on the assumption that a rising tide lifts all boats, traders should also try to understand the direction of the main trend even though they themselves are only concerned with a short time horizon. A convenient way to chart longer-term trends is to use a smoothed momentum indicator such as the stochastics or KST.

