
Articles
How to Trade Forex Using Dynamic Support and Resistance
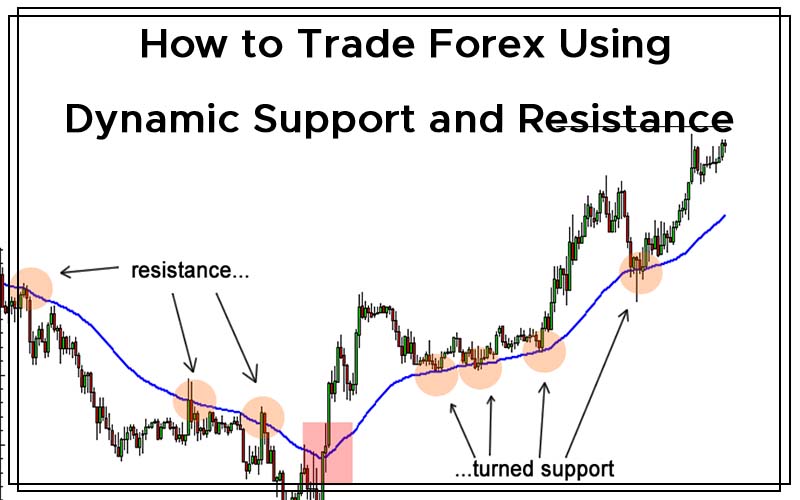
Evolving or dynamic support and resistance is one topic that has been attracting many questions, especially from newer students. This article discusses what dynamic support or resistance represents and how you can use it in trading.
Static Resistance/Support Models: Examples
Before discussing dynamic support or resistance models, let us look at the more traditional static models. The most popular ones are:
- The horizontal lines
- Fibonacci levels
- Pivot points
- Trend lines
- Channels and so on…
Any kind of support and resistance levels that do not change is considered static. For instance, Fibonacci level once drawn for a move does not change over time. However, it does not mean that you cannot draw new lines, but the ones drawn will never adjust themselves based on the market.
Here is a chart illustrating support and resistance levels and pivot system:
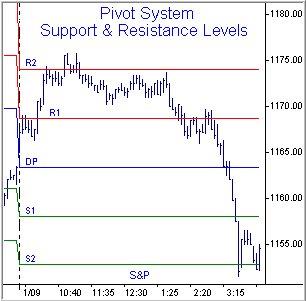
(Source: http://www.fxstreet.com/education/technical/tech-tools-active-trader-tech-capturing-profits/2009/12/23/03/)
While price action reacts at many key static levels of support and resistance, traders must know how to spot them. The reason fortheir success is that big players use their money at those key levels. And since the market and traders have a memory, a level once thought to be significant will again become one.
The truth is that prices do not trade in static world. It is evolving every second, breaking out of main support and resistance levels. This often results in the creation of historic new lows and highs where price has never been. In case of only static models, traders will feel paralyzed when there is no historical price action.
Here is when the role of dynamic support and resistance levels features in, as they evolve with the market real time. Here is how the dynamic support and resistance levels model works.
Types and Everyday Use
While there are many hundreds of indicators, here is a small list of how to draw dynamic support and resistance layers. Some examples include:
- Moving Averages (exponential, simple and so on)
- Price Channels
- Linear Regression Lines
- Ichimoku Kinko Hyo
These are called upper chart indicators, as they are in the upper parts of the chart that interact with price action, as that is what they are based on. Their interaction with price makes them useful to traders and creates trading opportunities. Besides, the dynamic, evolving and interact with price action in consistent ways, they are used as a type of support and resistance.
Elements of Everyday Use
Most well-known forex experts use 20 ema (exponential moving average) when trading action. This is because price usually reacts to the 20 ema more than anything else, thus reinforcing their belief that larger players are more likely to use it than any other EMA. If that were not the case, prices would not react to it so consistently over time. This is applicable on any time frame, starting from minutes to hours and days.
Here is an illustration:
15-minute chart of GBP/USD
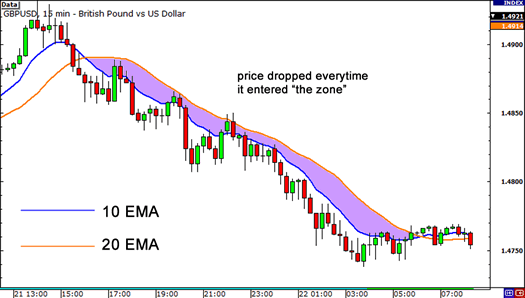
Price action can relate to the 20 ema, offering great trading opportunities while representing the functionality of dynamic support and resistance. This means that in a range-bound setting, the 20 ema will hardly do anything, as price is stuck with already existing support and resistance.
However, in a trending market, it can become a very effective trading tool as it communicates a variety of information. Examples of what it can communicate are;
1) speed of buying/selling
2) whether trend is overextended
3) whether reversal is forming
4) locations to get back in and momentum in a trend.
So as one can see above, the 20 ema is highly valuable in offering critical information and opportunities to get into the market, especially in trends. Institutional traders usually use 20 ema to get back into the trend at cheaper prices.
How to Use It
There are many ways of using 20 ema as dynamic support or resistance. However, the one major way is called the Trend-Continuation or Trend-C method. This is used as a chance to get back in the trend, when the trend has shown a probability of continuation. It is certainly true this technique can be used on any time frame, many will prefer using it on the 1hr, 4hr and daily charts.
Two key thing to consider before getting into a trend:
-Price should already have a stable relation to the 20 ema
-Price already tested the 20 ema once, failed to close below or above it and the trend continued after relating to the 20 ema.
If the trader finds these two are in place, look for a Trend-C entry to get into the trend using 20 ema as the trigger.
An Example
In the chart below price had a very patterned and predictable relationship to the 20ema with several touches (8 prior) off the 20ema, which resulted in price continuing higher. One may observe on the last bar on the top right of the chart, one can see how price had its largest pullback in this upmove, landing right on top of the 20ema.
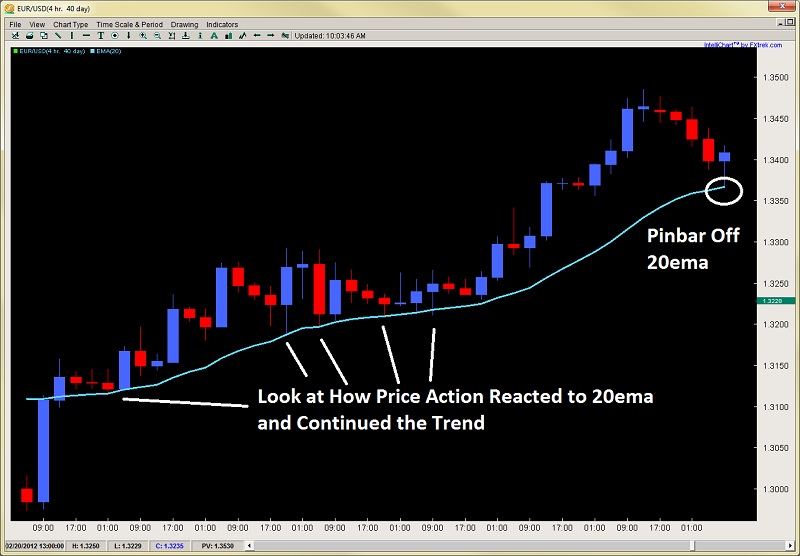
Using this clear rejection off price with a nice pin bar setup, if one waited for a pullback into the pin bar itself, then took a long with the stop just below the 20ema itself, they would have profited highly as you can see by the follow up chart below.
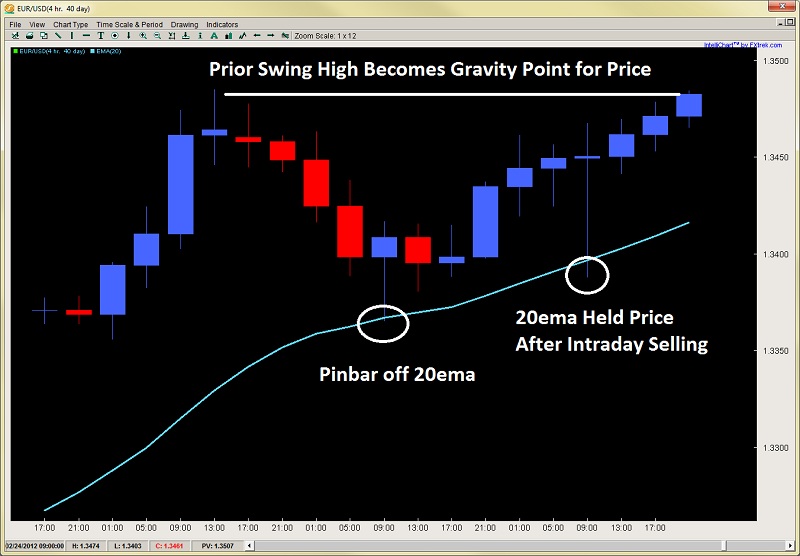
Thus;
1) Make sure to look for price to set up a relationship to the 20 ema, with a clear direction above or below it.
2) Then, look for price to respect the 20 ema, by rejecting off of it or closing below/above it in the direction of the trend with no closes on the opposite of 20 ema and where price is trending.
Then look for price action trigger such as engulfing bar, pin bar, piercing pattern or a strong rejection off of it. Then, try taking the pullback to the level and put the stop on the other side of the 20ema, below the high/low of the candle that pierced 20 ema. Then, target a major swing point to have a 2:1 reward to risk ratio.
If the market is expected to go for a runner beyond the swing point, then trail stop on the other side of 20ema; this ensures breathing space, while also locking in profits.
In Closing
In the article above, we have shown a few of the ways a trader can use the 20 ema as dynamic support or resistance level. In practice, static support and resistance models are only half the picture and the levels will be broken; so placing orders there, expecting a price stop is not a good idea always.


