Articles
Double Bottoms

The mirror image of a double top, the double bottom is a more profitable longer-term play. Find out why. At first, I thought double bottoms were just double tops flipped upside down, but I was wrong. It’s not the formation that’s the puzzle; it’s the price trend leading to a double bottom. With double tops and many reversal patterns appearing near the top of a price series, the approach leading to the pattern is usually steep.
Prices rise rapidly, execute a reversal pattern, then drop just as quickly. With bottom formations, you can still have that type of behavior — a catastrophic decline that turns and the stock recovers. However, it is also possible that you could witness a quick decline, then a slower, torturous downtrend as prices continue to drop even further, spread out over many months. To detect double bottoms automatically, I couldn’t just flip around the computer code to detect tops. I had to change the algorithm to accommodate the possibility of a meandering decline. Once that was accomplished, the program I designed to search my database was correctly detecting double bottoms in many of the stocks I follow.
DOUBLE BOTTOMS
What exactly is a double bottom? Consider the charts of California Microwave [CMIC] and The Bombay Co. [BBA] shown in Figures 1 and 2, respectively. Both charts show double bottoms, but on different time scales. CMIC shows a steady but steep decline in the stock price on a weekly time scale. The stock declined from a high of $393/4 in early January 1995 and finally reached bottom in late July 1996 at$117/8, a decline of 70%. After hitting bottom, the stock made an unconvincing attempt at rising upward.
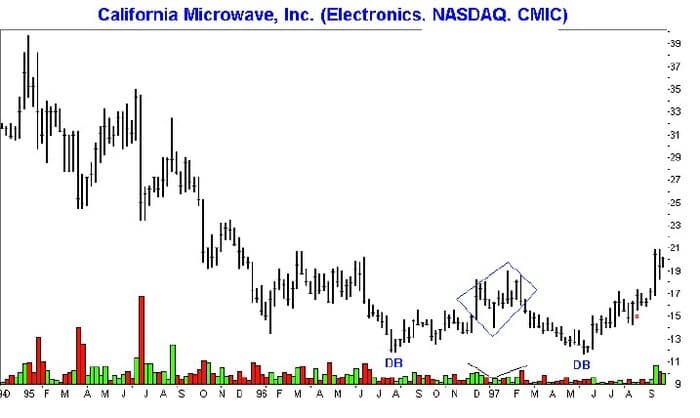
FIGURE 1: A TYPICAL DOUBLE BOTTOM ON A WEEKLY SCALE. After a long decline, the stock hits bottom, bounces, then starts rising again. The rare diamond reversal formation appears as a double top on the daily time scale.
The rounding turn reached a high point in January 1997. Looking at the weekly chart, the price began forming a diamond reversal, somewhat irregular in shape, which completed in mid-February. Although the diamond may be classified as a head-and-shoulders formation, the unsymmetrical shoulders and V-shaped volume pattern suggests that the formation is better classified as a diamond. Either way, the prognosis was bearish.
After the reversal completed, prices headed down again. The diamond suggested that prices would decline by the measure rule for a diamond: The height of the diamond, in this case $5 ($19-14, measured high to low). However, there is an alternate measure for nearly all reversal formations. The reversal will carry back to the level where the trend began. The reversal must have something to reverse.
In this case, prices after the diamond reversal could be expected to decline to the prior bottom low, and that’s just what happened. In late May 1997, prices declined back below the $12 level and the diamond measure was effectively fulfilled. With prices declining to the same level, or close, a double bottom took shape. The volume pattern at either bottom was nothing spectacular and did not suggest that a rise in prices would follow. By June, however, prices started climbing once again and moved above the top level of the diamond reversal in mid-September on substantially higher volume. This confirmed the double bottom.
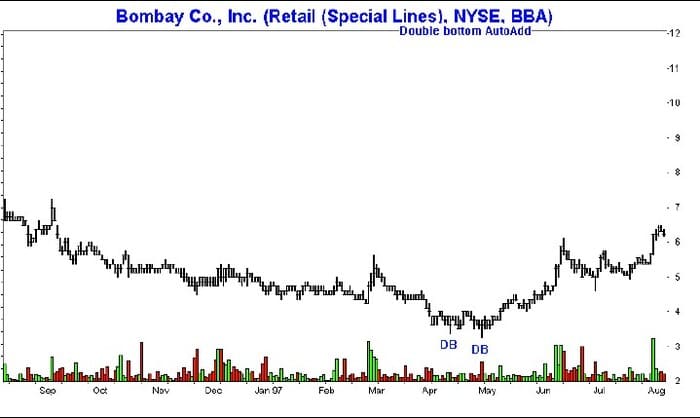
FIGURE 2: STEALTH DOUBLE BOTTOM. This rambling decline ended in a double bottom during April with a low of $3-1/4. In September, the stock reached $9.
The rounding arc between the two bottoms is characteristic of bottoms spaced widely apart. Narrow bottoms, like that shown in Figure 2, are more difficult to recognize, as they appear as normal price fluctuations. But Figure 2 shows a slightly different approach. After seeing a large price rise and decline during the February to July 1996 period (not shown), when prices more than doubled, the stock completed a small bump-and-run reversal in early September 1996 and started drifting down. In March 1997, the decline accelerated and formed an uneven double bottom.
Volume at the second valley was comparatively high but soon dropped off even as prices rose. In June, after rising above the prior minor high in late February, volume moved up but then stalled along with prices. Prices moved downward, retracing some of its move, then started climbing again. Price reached a high of $9 in mid-September, a rise of nearly 180%.
BOTTOM CHARACTERISTICS
If you had to define the general characteristics that double bottoms shared, what would you say? I searched through my database of stocks and marked those formations I believed were double bottoms using the classic definition. After becoming acclimated to the formation, I reviewed my work and programmed my computer to detect them automatically. However, my definition varied somewhat from the classical style. The differences can be seen in Figure 3.
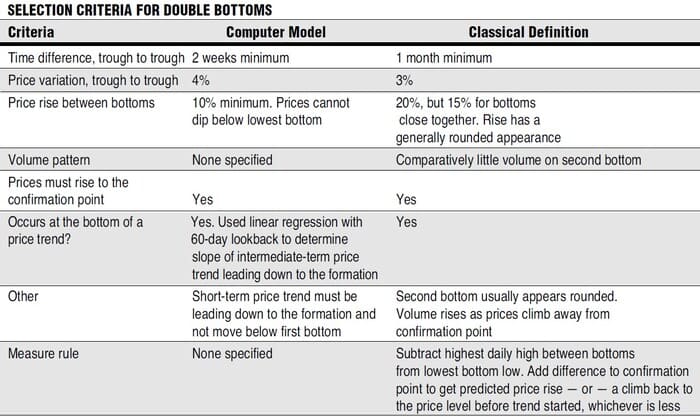
FIGURE 3: Criteria is suspiciously similar to double tops. A 4% bottom to bottom price variation was used because bottoms were more irregular. The two bottoms must be at least two weeks apart and appear at the end of a downtrend.
I chose to use two weeks as the minimum time between bottoms. The one-month minimum is an arbitrary designation, and I wanted to include as many valid formations as I could. After reviewing the performance of my selections with those of the classic definition, my selections performed nearly as well and, by one measure, substantially better.
Unlike double tops, double bottoms have more uneven bottoms. To compensate for this, I increased the bottom-to-bottom price separation, suggested by the classic definition, from 3% to 4%. Since I allowed the bottoms to be closer together, I decided to reduce the minimum rise between the bottoms from 20%to 10%. This decision makes intuitive sense: There is simply less time for prices to vary when bottoms are only two weeks apart than when separated by a month or more.
The classic definition of double bottoms also makes the observation that the rise between the two bottoms may appear rounded. I made no such stipulation in the computer model, except to say that prices cannot dip below the lowest bottom. In addition, prices leading to the formation should rise up and away from it. This rule simply instructs the computer to select bottoms that are true bottoms, not short-term downdrafts in an uptrend.
Although the classic definition suggests that there is comparatively little volume on the second bottom, I imposed no such restriction on the selection process. The results of the statistical analysis would confirm or deny the classic definition assertion. There were several agreements between the computer model and the classic definition. Prices must rise above what I call the confirmation point — the top of the rise between the two bottoms. This price level must be exceeded after the second bottom before a double bottom is confirmed. If prices fail to rise above this point, it’s not a double bottom.
While that stipulation may sound like obvious, it is nevertheless important. If you intend to purchase a security because it’s making a double bottom, you should wait for confirmation. Confirmation only comes when prices rise above the confirmation point. If the formation is not confirmed, prices are likely to continue moving down.
The classic definition of double bottoms makes the observation that the rise between the two bottoms may appear rounded. I made no such stipulation in the computer model, except to say that prices cannot dip below the lowest bottom.
Another rule that may seem obvious is the one that double bottoms occur at the end of a downward price trend. You won’t find valid double bottoms after a long price rise. Double bottoms are reversals, and prices can be expected to climb away from the formation once it rises above the confirmation point. Since the measure rule for double bottoms is not a selection criterion, none were specified for the model. However, the classic definition suggests that a minimum price rise can be predicted. Subtract the price at the lowest bottom low from the confirmation point. Add the result to the confirmation point, and the result is the minimum price level to which prices should climb — at a minimum.
The measure rule is applied in Figure 4, a chart of VLSI Technology [VLSI]. The stock bottomed at a daily low price of $10 3/8 in late July 1996. The confirmation point, or the highest high between the two bottoms, occurred in mid-May at a price of $20 3/8 for a measure of $10 (that’s $20 3/8-10 3/8). The result is added to the confirmation point to reach a target price of $30 3/8. This point was reached in early August 1997 when prices climbed above $30 for the first time in almost two years. On the weekly time scale, the W-shaped double bottom is obvious to those looking for the chart formation.
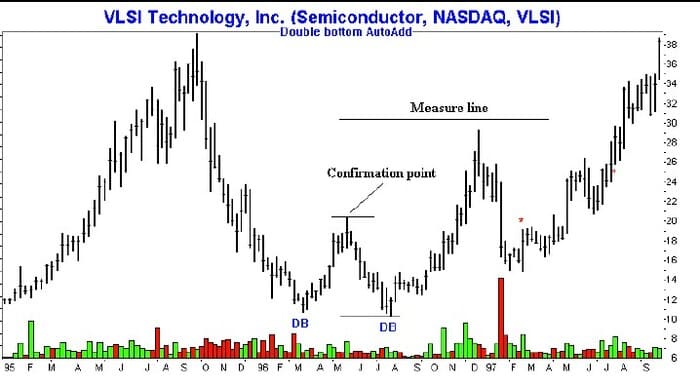
FIGURE 4: THE MEASURE RULE FOR DOUBLE BOTTOMS. Compute the differ-ence between the lowest bottom and high price between the two bottoms. Add this to the confirmation point to get the price target, shown here as the measure line.
If you look at Figure 4 more closely, you’ll see that the target price was almost met in mid-December 1996. VLSI reached a high of $29 1/4, just short of the target of $30 3/8. From that point, however, prices rapidly retraced and hit bottom at $14 7/8 just two months later. That’s a 50% decline! Even more disturbing is that it fell below the confirmation point, the point at which investors, expecting a rise, could be expected to buy the stock. At $20 3/8, that level was almost 30% above the level to which prices declined before turning around.
There are two ways to look at the purchase price of $20 3/8. The short-term view was a quick 44% rise to $29 1/4. If you didn’t sell near that level, then your gains would be completely lost in the plunge to $14 3/8. In contrast, the longer-term view would be markedly happier. If you held on through the decline and patiently waited for the stock to recover, it recently reached a new high of $35, more than 70% above the purchase price.
The moral of the story is that it’s probably best to take profits when the measure rule is fulfilled, or close. Place a stop an eighth of a point below the most recent support level as the stock moves up. Should the stock start to decline, you’ll be stopped out and have to wait for the stock to bottom before considering another purchase.
BOTTOM STATISTICS
I found a large number of double bottoms in my database. Of more than 300 stocks examined in my database during the past two years, 110 had at least one double bottom, with another 23 showing multiple double bottoms. If you restrict the double bottoms to the classic definition, there were 52 stocks, or 39% showing one or more double bottoms.
Of the stocks showing a double bottom, 92% indicated a reversal of the downward trend. The classic definition also achieved a 92% success rate, a very high number. This number is even higher than the 91% success rate attributed to the highly acclaimed, head-and-shoulders top formation. In addition, the double bottoms were found during a raging bull market, so a high success rate is not unexpected.
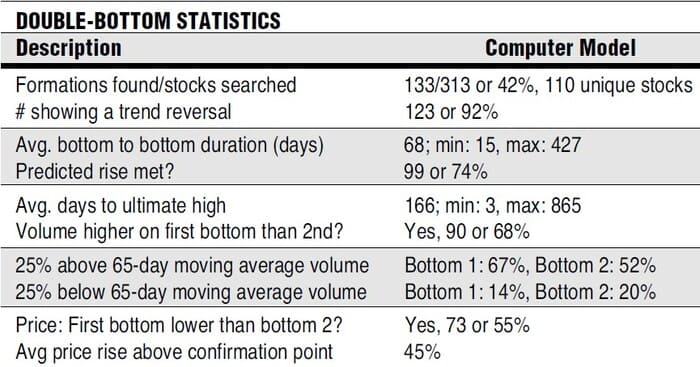
FIGURE 5: The average price rise after a double bottom was 45%, with only 8% failing to show a reversal of the downward trend.
What was the time between bottoms? On average, the bottoms were separated by 68 days — a little over two months. I allowed the computer to select bottoms that were no less than two weeks apart, and the minimum separation turned out to be 15 days with a maximum of 427 (one year, two months).
Was the predicted rise in the stock actually met? Three out of four (74%) stocks met or exceeded the predicted price level (the measure rule). This compared with only 60% using the classic definition. For the stock to rise to its ultimate high required almost six months (166 days), suggesting that double bottoms are long-term trend reversals.
Was volume a factor in the formation? Volume was higher on the first bottom about two-thirds of the time. However, both bottoms experienced volume that was significantly higher than the 65-day moving average of the volume. Volume that was 25% above or below the moving average was logged as significant. Two-thirds of the first bottoms and slightly over half the second bottoms showed high volume, while 20% or less showed volume that was significantly below average. In essence, you can expect double bottoms to show above average volume on both troughs, with higher volume on the first bottom.
Once a double bottom occurs, how far will prices climb?The average rise was 45%, but for double bottoms following the classic approach, the rise was a more robust 51%. This was measured from the high at the confirmation point to the ultimate high price. While double tops showed only an 18% decline, double bottoms performed much better. Why? My guess is that the bull market retarded the decline from a double top while propelling the stocks higher after a double bottom. The situation may change under different market conditions, but the sheer number of double bottoms analyzed lends significance to the performance statistics.
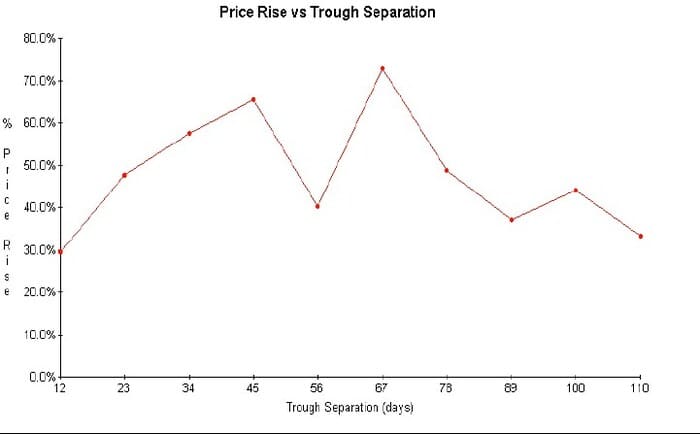
FIGURE 6: BOTTOM SEPARATION VERSUS ULTIMATE PRICE RISE. Do bottoms closer together show smaller gains?
Figure 6 shows the relationship between the ultimate price rise and separation between bottoms. Do bottoms closer together rise less than those spaced farther apart? Double tops showed a tendency to decline farther when the tops were closer together. This figure suggests just the opposite for bottoms. The line seems to round over as the trough separation lengthens.
The frequency distribution of the 10 bins used to hold the days between bottoms was more uniform than that shown for double tops. Still, two bins had only four and five entries each, and it would be prudent to conduct additional research with more samples before trying to attach any significance to the figure. Figure 7 illustrates the relationship between bottom separation and the confirmation height (the rise between the bottoms). The figure shows that bottoms closer together showed less of a rise than those spaced farther apart. This makes intuitive sense, since widely spaced bottoms have more time for prices to rise between them.

FIGURE 7: RISE BETWEEN BOTTOMS. Bottoms closer together leave less room for the stock to rise.
FAILURES
Figures 8 and 9 show two views of double bottom failures. The first chart, of DSC Communications Corp. [DIGI], begins with a bump-and-run reversal that follows the trendline up. It culminates in the bump that ends as a head-and-shoulders top. Prices decline below the neckline and continue down, just as the BARR predicts. The measure of the BARR suggested a minimum decline to $34 3/4, which was fulfilled on the first trough of the double bottom. The head-and-shoulders formation price target was even higher. The target of $45 1/4 was reached on October 6, 1995, when prices plunged $8 from $52 3/8 to $44 3/8 when the company announced that its earnings would not meet expectations.
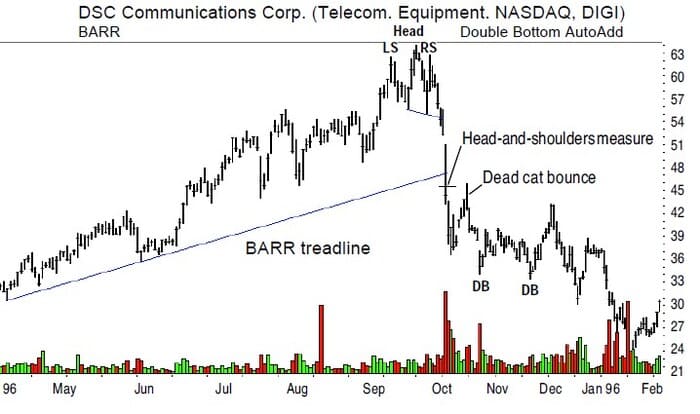
FIGURE 8: FAILURE IN DSC COMMUNICATIONS. The measure implications of the bump-and-run reversal and the head-and-shoulders were met on or before the price level of the double bottom. Less than a week after prices climbed above the confirmation point, they started moving downward. The stock reached a low of 12- 5/8 in November 1996.
After such a swift decline, an investor can expect a dead-cat bounce†. This pattern can be seen in mid-October. Prices bounced off the low of $36 5/8 to reach a high of $45 7/8 five days later, before prices started declining once again. This is the normal pattern after a severe decline. You get the bounce and then prices return to their lows and meander down still further.
Figure 9, which shows General Housewares Corp. [GHW], shows a similar situation. The stock formed a double top in the February–March 1995 period and started moving down. It declined from a high of $16 3/8 to a low of $8 3/4 at the left bottom trough. Volume was above normal and prices responded by climbing again. Prices worked their way down on low volume and formed the second trough of the double bottom.
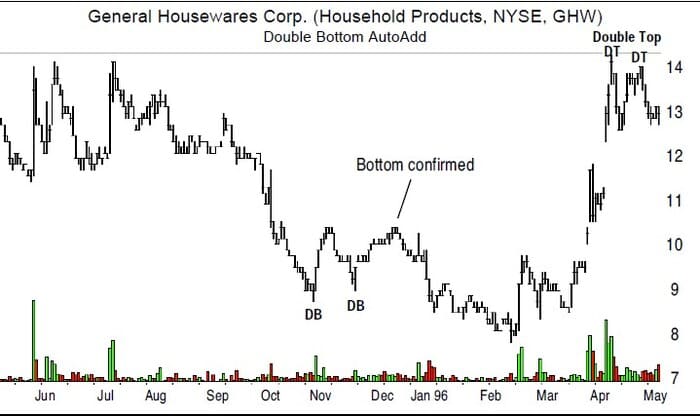
FIGURE 9: DOUBLE FAILURE THAT TURNED AROUND. The decline began with a double top (not shown) and was marked by a double bottom. Prices were confirmed when they reached 10-3/8 on December 6, 1995. There, prices hovered for two days before starting down again. The stock declined to a low of 7-7/8 before turning around and climbing to a high of 14-1/8.
From this point, prices bounced up and climbed to the confirmation point at $10 3/8. Three days later, prices faltered and started moving lower. They continued down, reaching a low of $7 7/8 in early February 1996. From that point on, prices climbed again and reached a high of $14 1/8 in early April. At that point, the stock completed a double top and headed lower. Is there a way to limit exposure to failed double bottoms? Yes, but that involves trading tactics. Keep reading.
BOTTOM FISHING
How do you make an investment in a stock showing a double bottom? Consider an investment in the stock of Southwest Airlines Co. [LUV], shown in Figure 10. Say you watched from the sidelines as the stock formed a double top in the March–April 1996 time frame. As expected, the stock dropped and confirmed the formation a few days before the beginning of May, when prices dropped below the trough low. After that, the stock continued moving down until mid-July, when the predicted measure of the top was fulfilled.
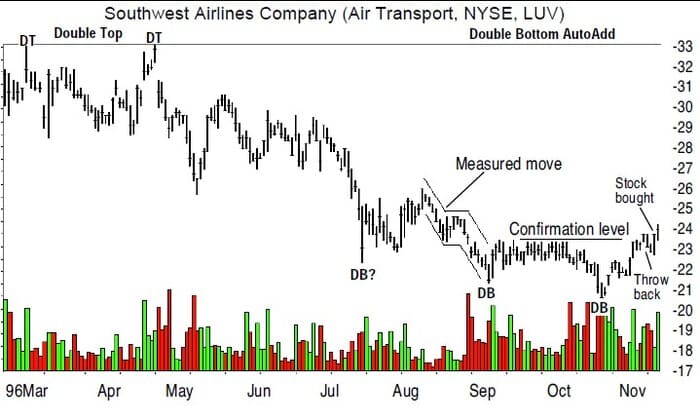
FIGURE 10: HOW DO YOU TRADE THIS STOCK? Consider building a position once the bottom is confirmed and not before.
The stock moved sideways for almost two months before plunging in a measured move formation and stopped at the left side of the double bottom. The stock bounced up and rounded over to form a lower bottom on volume that was generally higher than on the left bottom. The two bottoms were clearly more than two weeks apart, so another of the identification criteria was met.
However, the two bottoms were not on the same price level, so the difference had to be verified. On checking to see how far apart the prices were, say you discovered that the first bottom occurred at $21 3/8 and the second at $20 5/8, or 3.6%apart (that’s (21.38-20.63)/20.63), comfortably below the 4% threshold for double bottoms.
And then you noticed the one-day spike downward on July 16. Why didn’t this become the left bottom instead of the one chosen? You checked the bottom-to-bottom price difference and discovered that it was a wide 4.7% — too far away for a valid double bottom. And then you noticed that the formation was never confirmed. Prices failed to rise up and surpass the level achieved between the two bottoms before forming a new, lower low.
Again, you focused on the double bottom as pictured. Prices had risen to the confirmation point — the highest high between the two bottoms (at $23 1/2). Was it time to buy? The stock climbed from a low of 20 5/8 to $23 1/2, a 14% run without a break. It was possible that the stock would retrace some of its gains, since most bull runs occur in a stair-step† fashion. Four days later, the stock dropped back below the formation top, so you considered placing a market order — but then you noticed the inverted T-shape of the stock on that day (November 8). This formation suggested that prices would fall below the current day’s low sometime during the trading day.
With this in mind, you monitored the stock throughout the day and issued a market order when the stock traded below the prior day’s low, succeeding at buying the stock at the low for the day, $22 3/4. You were relieved to see that the stock had closed up a dollar from the purchase point. Over the next several days, the stock continued climbing until November 20, when it entered a choppy consolidation pattern at about $26. The target price according to the double bottom measuring rule was $26 3/8, very close to where the stock was topping out.
At that point, you were getting nervous but decided to hold on, as a 14% rise from the purchase point wasn’t high enough to justify cashing out. I flipped to the weekly chart (Figure 11) to examine the support and resistance levels and discover massive resistance at the $26 level, precisely where the stock had stalled out. As the stock tumbled, you looked again at the weekly chart for support levels and saw that the stock should halt at $23 1/2 — the top of the formation. If it broke that level (which it did), the stock could be expected to decline to about $20 before coming up against any measure of support.
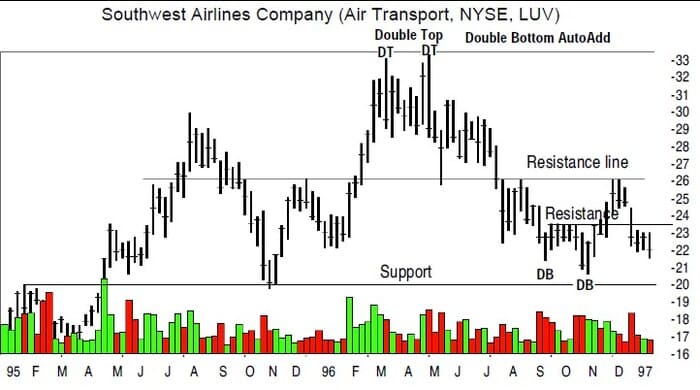
FIGURE 11: THE STOCK ON THE WEEKLY CHART. Shown are the support and resistance levels that should have been identified before the trade was placed.
You decided to hold onto the stock, justifying your actions by telling yourself It’s a long-term holding, a common refrain for novice investors when their trades go bad. However, your luck held, as the stock bottomed out. The stock retested the low by touching $21 1/4 before advancing in fits and starts over the next several months. Recently (Figure 12), the stock climbed to $33 and you again considered taking a profit. The stock has risen 45% since you purchased it. The figure exactly matches the average rise for double-bottom reversals. Lucky? You bet.
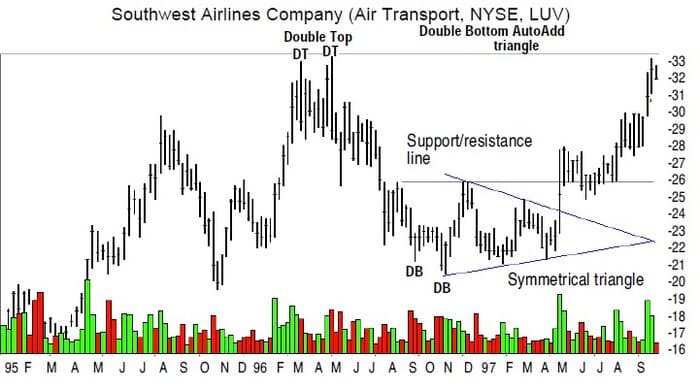
FIGURE 12: RESULTING PRICE ACTION. The stock formed a symmetrical triangle from which prices eventually climbed. The earlier resistance level at $26 turned into support during May through July.
How should an experienced investor handle this trade? First, the trader would have determined the risk-reward relationship for this investment before placing the buy order. How far was the stock likely to move up and how low would it fall if things went bad? Check the support and resistance levels to gauge likely future price movements. Look for a 1:4 ratio between risk (the decline where support is found) and reward (the likely rise before running into resistance).
When the trade is placed, a stop-loss order 3/16 below the lowest bottom low would have been placed. If the investor could tolerate such a loss, the level would have protected the trader from the formation, regrouping and forming a triple bottom. I’ve noticed a few situations where prices drop to an eighth below the lowest low, which is why 3/16 was chosen.
If the investor is not willing to take such a large loss, then look for a support level below the purchase price. Place the stop an eighth or 3/16 below this point. Once the stock moves up by 10% or so, raise the stop to break even. Although doing so for this trade would have taken you out prematurely, it’s wise to become accustomed to proper money management procedures. Don’t form bad habits. If a trade acts differently from what you expect, look elsewhere for a more profitable opportunity.
SUMMARY
A double bottom is a long-term price reversal chart pattern. It can be identified on the daily or weekly charts after a long- or intermediate-term decline in the stock. The two bottoms should be located at approximately the same price level and at least two weeks apart. Prices should rise at least 10% between the two bottoms. The formation is confirmed by prices rising above the confirmation point — the highest price between the two bottoms — after the second bottom. Once the formation is confirmed, consider taking a long position in the stock. If the formation is not confirmed, do not take a position as the trend will likely continue down.
The formation measure to determine the predicted price target is computed by taking the difference between the highest point between the two bottoms and the lowest bottom. This difference is added to the confirmation point and results in the target price. The target is met 74% of the time and can be expected to be a minimum price move. The stocks in my database ascended 45%, on average, with only 8% of the formations failing to reverse the downward price trend.

