Articles
Are Three-Bar Patterns Reliable For Stocks?

Futures traders often use a three-bar swing low as a reversal pattern, but is the three-bar pattern reliable for stocks? Find out here. I discovered this gem of a pattern while prospecting for ideas in my last articles. In the interview with Kevin Haggerty was the following pattern description:
One example [to determine a change in direction] is a three-bar pattern, which is the same one that futures traders use. The stock establishes a low price as a swing point. Once the stock closes above the high of the low day, to me, that is a change of direction for an undetermined period.
Using this description as a guide, I decided to formalize the shape and behavior of the pattern.
IDENTIFICATION RULES
What does the pattern look like? Here is my interpretation. The pattern conforms to the following rules:
- It uses daily prices, not intraday or weekly prices.
- The middle day of the three-day pattern has the lowest low of the three days, with no ties allowed.
- The last day must have a close above the prior day’s high, with no ties allowed.
- Each day must have a nonzero trading range.
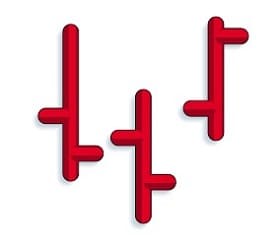 I limited my selection and testing to daily prices, not weekly or monthly prices. I didn’t use intraday pricing because the pattern description mentions closing prices. Although the paragraph describing the pattern says that a swing change occurs once prices close above the prior high, I interpreted that to mean the very next day, not several days in the future. It is, after all, a three-bar pattern, not a five- or six-bar pattern.
The first and third days must have a higher low than the middle day, with no ties allowed. This is suggested by the phrase swing point in the description of the pattern. Finally, each day must have a nonzero trading range. I added this rule to remove thinly traded stocks in which the high, low, and close are all at the same price. I did not want low-volume days or thinly traded stocks to influence the behavior of the typical pattern.
Figure 1 shows two three-bar patterns; the one on the left successfully acts as a reversal of the downward swing, while the right one fails when prices turn down after the pattern is completed. Most of the time, the price pattern continues upward; in fact, prices make a higher high the day after the formation ends 58% of the time, but this steadily decreases to 52% a week later. (About half the time, prices are still above the formation a week later.)
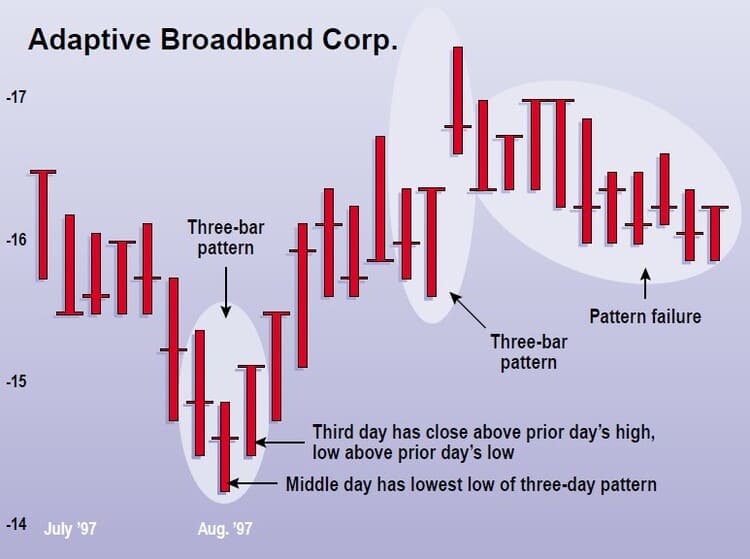
FIGURE 1: THREE-BAR PATTERN, SUCCESS AND FAILURE. The three-bar pattern suggests a swing change. The pattern on the right failed because prices didn’t continue to move higher.
Once you can identify a three-bar pattern, how does it behave?Figure 2 shows optimum behavior of the pattern at point A. According to the description, the pattern should show a change of direction — from down to up. The figure shows that after trending down from the start of May, the formation marked the low turning point exactly. After the three-bar pattern completed, prices continued rising and moved from $121/4 at the formation high to a trend high of $161/4, an increase of 33% in about three weeks. The stock continued rising in a stairstep fashion, ultimately reaching a high of $20 in early October 1997. Figure 2 shows the best-performing pattern in the study.
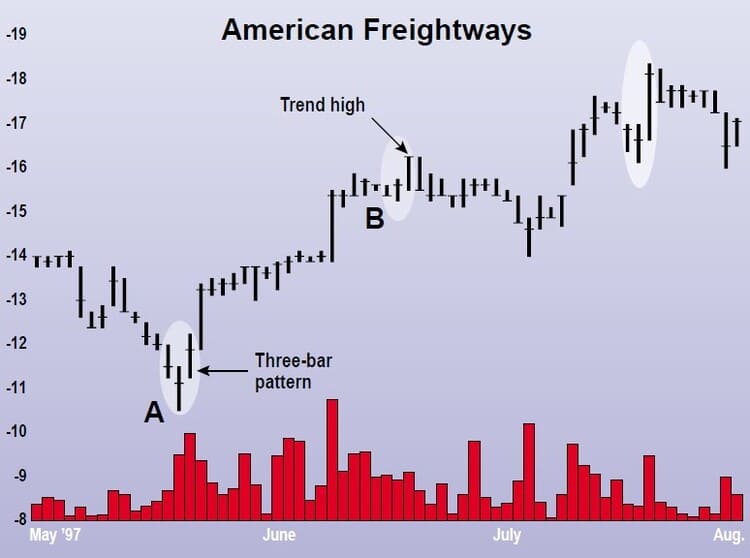
FIGURE 2: THREE-BAR PATTERN, ON THE RISE. The best-performing three-bar pattern shows a 33% rise from the formation high to the trend high in mid-June. Point B is a three-bar pattern failure because prices decline.
A pattern failure is also high-lighted at point B. Prices closed downward for two days before the pattern formed, then made a lower low at the swing point. The following day, prices closed at$161/4, above the swing day’s high of $153/4. However, instead of prices moving higher, they declined, reaching a low of $14 about two weeks later.
STATISTICS
After programming the formation, I discovered that the pattern is very common (more than 1,100 examples of this pattern occurred in 25 stocks I took a look at), so I limited the samples I would examine by confining the number of pattern occurrences to 10 for each stock, spread out over time. If there were 100 pattern occurrences in a stock, for example, I sampled every 10th occurrence and spread them out over the data. This allowed the pattern to be tested on several stocks during rising and declining price swings. The resulting statistics can be found in Figure 3.
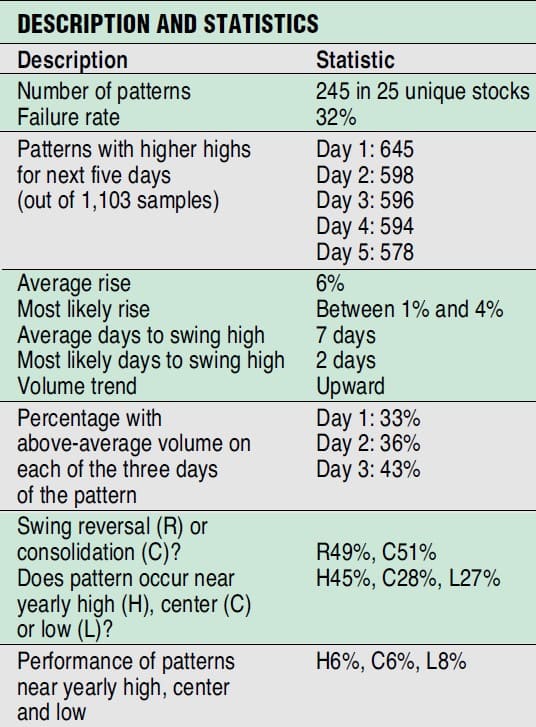
FIGURE 3: The three-bar pattern sports a 32% failure rate, with a likely rise of less than 4%.
I limited the number of stocks to 25 because the resulting 245 patterns were more than a representative sample. Most of the pattern occurrences were pulled from data beginning in 1997 to the present, but some went as far back as 1995. The failure rate is 32%. I judged a pattern to be a failure if prices did not continue moving up. Figure 4 shows three examples of failures. Each shows promise of prices moving higher, but prices continue down instead.
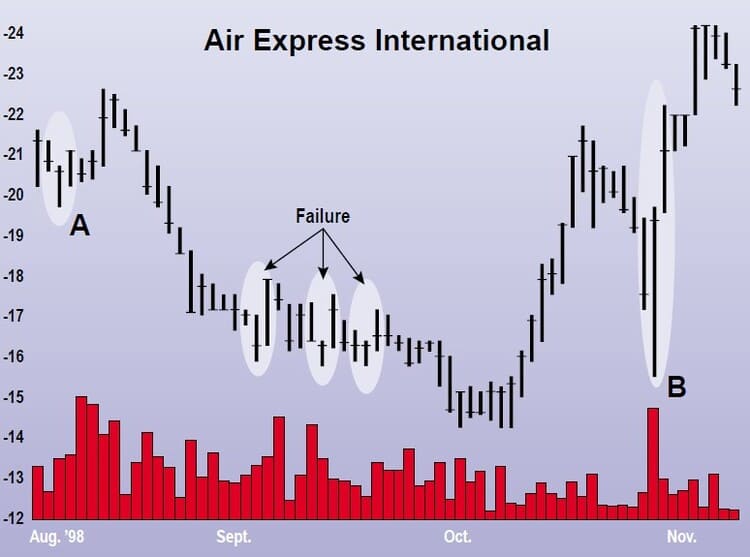
FIGURE 4: THREE CONSECUTIVE THREE-BAR PATTERN FAILURES. Volume offers no clue to the success or failure of the formation.
The other two patterns seen in Figure 4, shown on the left and right as A and B, do better. Pattern A foretells a 7% rise from $21 to $221/2. Although the closing and high prices decline after the pattern ends, I score this a success because the lows are clearly ascending and prices eventually break out to new highs without declining. Pattern B does better, climbing from a pattern high of $221/8 to a swing high of $243/8, a gain of 10%.
As a quick test, I set my software to identify all three-bar patterns in the 25 unique stocks and found 1,103 patterns. Then I tallied those patterns that had a price above the high scored by the formation on its last day. Successive daily highs were compared with the pattern’s last day’s high. Of the 1,103 patterns, 58%, or 645 patterns, showed a higher high the next day. This steadily decreased until it stood at only 52%, or 578 patterns, a week later, with a daily high above the formation’s ending high. The results are disappointing. If you see a three-bar pattern forming, don’t bet the farm that prices will reach a higher high the next day.
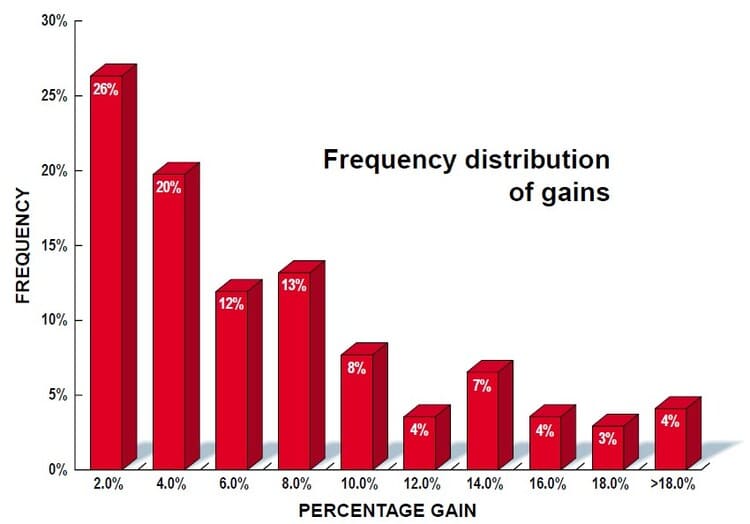
If you take all the successful three-bar patterns and average the gain, you get 6%. However, a frequency distribution of the results shows a more realistic result (Figure 5). The figure shows that the most frequent result is a 2% gain (column 1), with the 4% column close behind. The tallest column is the most likely rise because it better represents the return that an investor can expect. Almost half — 46% — of the three-bar patterns reach the swing high after gaining less than 4%.
- FIGURE 5: FREQUENCY DISTRIBUTION OF PERCENTAGE GAIN FOR SUCCESSFUL FORMA-TIONS. The average rise is 6%, but the most likely (46% of occurrences) gain is between 1%and 4%.
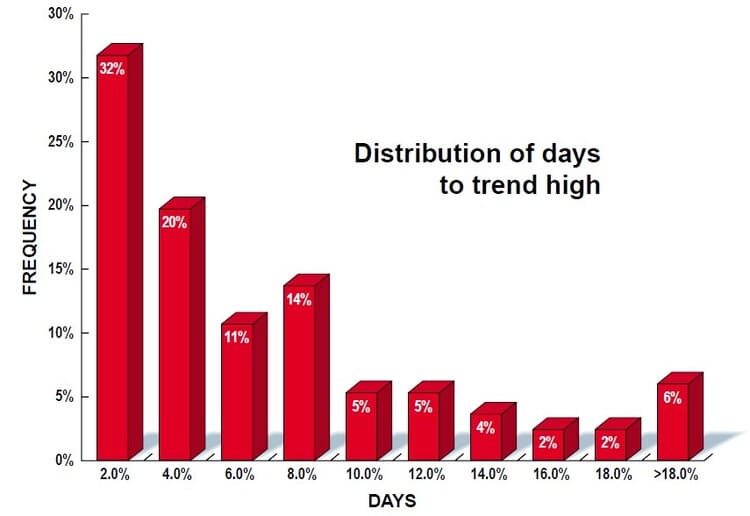
- FIGURE 6: DISTRIBUTION OF DAYS TO TREND HIGH. Shown is a frequency distribution of the days from the pattern end to the swing/trend high. Most patterns reach the swing high quickly, in less than four days.
After the formation completes, how long does it take to reach the swing high? On average, it takes a week. Figure 6 shows a frequency distribution of the days to the swing high for all successful patterns. The first column is the highest, implying that 32% of the formations reach the swing high in two days. Over half — 52% — reach the high in less than four days. A quarter of the formations take longer than 10 days to reach the swing (or trend) high, so the likelihood of your stock making an extended upward run grows progressively smaller as time wears on.
VOLUME?
Does the volume during the three-bar pattern offer a clue to the pattern’s performance? No. The slope of the line found using linear regression over the three days that the pattern was in effect indicates an upsloping trend. You can see this in the statistics of Figure 3, where I compare the volume with the moving average leading to the start of the formation. Only 33% of the first days show above-average volume, while 43% of the last days show above-average volume.
The pattern is almost evenly split (49% versus 51%) between acting as a reversal of the short-term price trend and acting as a consolidation. This isn’t bad news: how often do you find an indication that is either right or neutral but no (or very little) downside?
Just over half of the pattern failures (56%) appear within a third of the yearly high (22% each for the center third and lowest third ranges).
SEASONALITY?
Where in the yearly price range does the three-bar pattern appear? Almost half of the time that the pattern appears — 45% — have the high price of the last day within a third of the yearly high. The middle third and lowest third of the price range split almost evenly, with 28% and 27% of the patterns residing in those categories, respectively. When you substitute the performance of the patterns that fall within the high, center, and low yearly price ranges, I find that the best-performing patterns are those that appear within a third of the yearly low. They have an average gain of 8%, while patterns in the other two ranges have average gains of 6%.
LEARNING FROM FAILURE
Can we learn anything about conditions that lead to failure? A statistical examination suggests that failures cannot be predicted! For patterns that fail —when prices drop instead of continuing to move up— volume is above average on each of the three days I examined by rates of 27%, 49%, and 47%, not remarkably different from successful patterns. The linear regression volume trend is up as well, with 71% showing a rising volume trend, compared with 62% for successful patterns. Almost two-thirds (65%) of the patterns act as consolidations of the price trend, usually meaning that prices continue moving down after the formation completes. Figure 4 shows several examples of the pattern acting as a consolidation in a declining price trend (and failing to rise), while the failures in Figures 1 and 2 show what a reversal failure looks like. In Figures 1 and 2, the short-term price trend is up, then the pattern appears and prices consolidate before reversing, heading down.
Just over half of the pattern failures (56%) appear within a third of the yearly high (22% each for the center third and lowest third ranges). Again, there is nothing remarkable about these statistics. None of the statistics I examined offered a reliable clue to whether the price would move higher after the formation ended.
SUMMARY
As with all chart patterns, the real question is: Do you use the pattern? Two out of three patterns — 68% — are successful, rising by 6% on average. I like to see the success rate over the 80% level and gains for bullish chart patterns in the 35% to 40% range. However, those statistics are for larger formations, not a three-bar pattern. With short patterns, I examine the swing high instead of the ultimate high because the smaller patterns are less powerful; they are plentiful, but their influence is short.
Another point to consider is that the pattern has little short-term downside. If the next day’s prices don’t stay above the third day’s low, you are probably in a consolidation rather than a reversal. You can get out even, or with a small loss. I would not trade this pattern alone, but it would be reassuring if the pattern appeared when I was contemplating a stock investment. At least one investment professional, Kevin Haggerty, uses the pattern as a first step when considering trade placement. With the statistics I have presented, you should now have a better understanding of the pattern and can use it appropriately.

