Articles
Technical Analysis from A to Z

Millions of traders participating in today’s financial markets have shot interest and involvement in technical analysis to an all-time high. Technical Analysis from A to Z combines a detailed explanation of what technical analysis is and how it works with overviews, interpretations, calculations, and examples of over 135 technical indicators―and how they perform under actual market conditions. Enhanced with more details to make it easier to use and understand, this book reflects the latest research findings and advances. A complete summary of major indicators that can be used in any market, it covers:
- Every trading tool from the Absolute Breadth Index to the Zig Zag
- Indicators include Arms Index, Dow Theory, and Elliott Wave Theory
- Over 35 new indicators
Technical Analysis:
Should I buy today? What will prices be tomorrow, next week, or next year? Wouldn’t investing be easy if we knew the answers to these seemingly simple questions?Alas, if you are reading this book in the hope that technical analysis offers the answers to these questions, I’m afraid I have to disappoint you early—it doesn’t. However, if you are reading this book with the hope that technical analysis will improve your investing, I have good news—it will!
Some History
The term “technical analysis” is a complicated-sounding name for a very basic approach to investing. Simply put, technical analysis is the study of prices to make better investments, with charts being the primary tool. The roots of modern-day technical analysis stem from the Dow Theory, developed around 1900 by Charles Dow. Stemming either directly or indirectly from the Dow Theory, these roots include such principles as the trending nature of prices, prices discounting all known information, confirmation and divergence, volume mirroring changes in price, and support/resistance. Of course, the widely followed Dow Jones Industrial Average is an important component of the Dow Theory.
Charles Dow’s contribution to modern-day technical analysis cannot be understated. His focus on the basics of security price movement gave rise to a completely new method of analysis.
The Human Element
The price of a security represents a consensus. It is the price at which one person agrees to buy and another agrees to sell. The price at which an investor is willing to buy or sell depends primarily on his expectations. If he expects the security’s price to rise, he will buy it; if he expects the price to fall, he will sell it. These simple statements are the cause of a major challenge in forecasting security prices, because they refer to human expectations. As we all know firsthand, humans are neither easily quantifiable nor predictable. This fact alone will keep any mechanical trading system from working consistently.
Because humans are involved, I am sure that many of the world’s investment decisions are based on irrelevant criteria. Our relationships with our family, our neighbors, our employer, the traffic, our income, and our previous successes and failures all influence our confidence, expectations, and decisions.
Security prices are determined by money managers and home managers, students and strikers, doctors and dog catchers, lawyers and landscapers, and the wealthy and the wanting. This breadth of market participants guarantees an element of unpredictability and excitement as investor expectations swing from exuberance to terror.

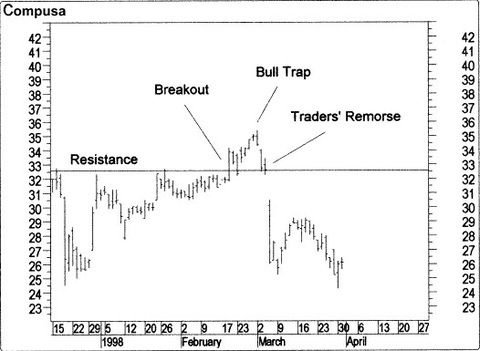
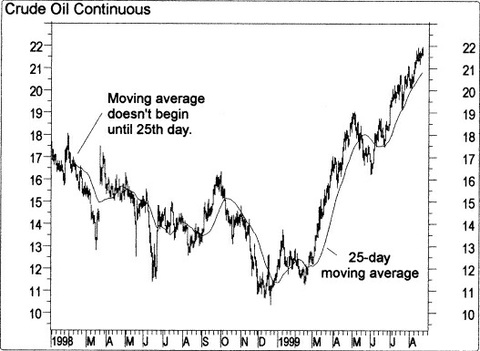
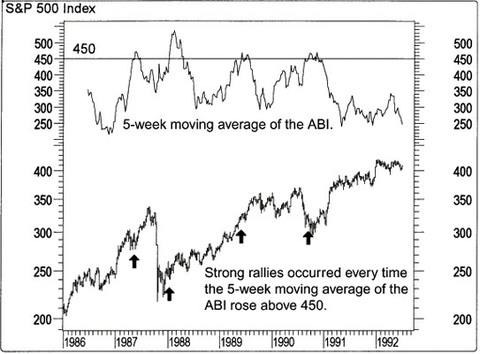
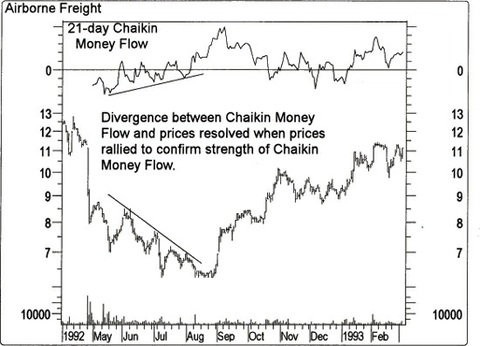
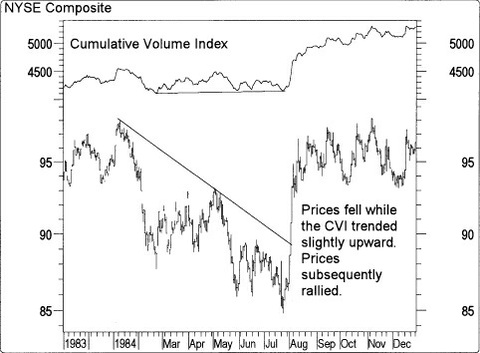
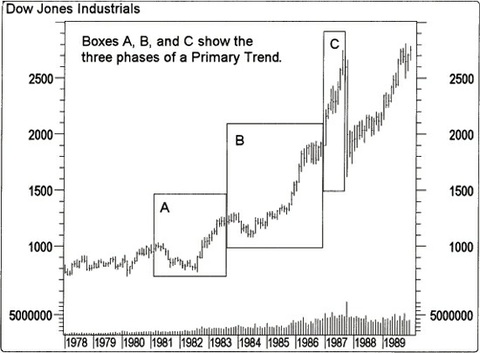
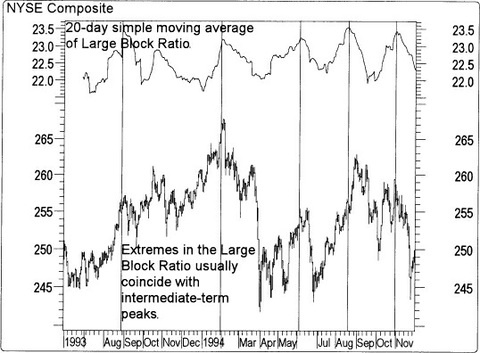
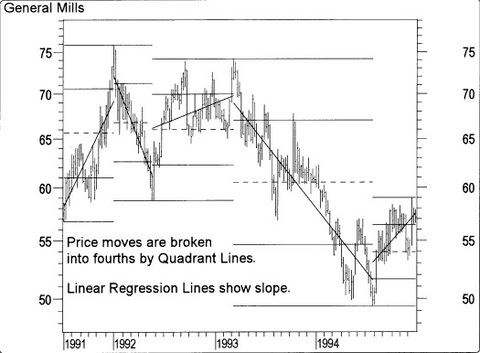
Some Pictures From the Book
Table of Contents:
PART ONE: INTRODUCTION TO TECHNICAL ANALYSIS:
- TECHNICAL ANALYSIS
- PRICE FIELDS
- CHARTS
- PERIODICITY
- THE TIME ELEMENT
- SUPPORT AND RESISTANCE
- TRENDS
- MOVING AVERAGES
- INDICATORS
- MARKET INDICATORS
- LINE STUDIES
- A SAMPLE APPROACH
- CONCLUSION
PART TWO: REFERENCE:
- ABSOLUTE BREADTH INDEX
- ACCUMULATION/DISTRIBUTION LINE
- ACCUMULATION SWING INDEX
- ADVANCE/DECLINE LINE
- ADVANCE/DECLINE RATIO
- ADVANCING-DECLINING ISSUES
- ADVANCING, DECLINING, UNCHANGED VOLUME
- ANDREWS’S PITCHFORK
- ARMS INDEX (TRIN)
- AROON
- AVERAGE TRUE RANGE
- BOLLINGER BANDS
- BREADTH THRUST
- BULL/BEAR RATIO
- CANDLESTICKS, JAPANESE
- CANSLIM
- CHAIKIN MONEY FLOW
- CHAIKIN OSCILLATOR
- CHANDE MOMENTUM OSCILLATOR
- COMMODITY CHANNEL INDEX
- COMMODITY SELECTION INDEX
- CORRELATION ANALYSIS
- CUMULATIVE VOLUME INDEX
- CYCLES
- DEMAND INDEX
- DETRENDED PRICE OSCILLATOR
- DIRECTIONAL MOVEMENT
- DOUBLE EXPONENTIAL MOVING AVERAGE
- DOW THEORY
- DYNAMIC MOMENTUM INDEX
- EASE OF MOVEMENT
- EFFICIENT MARKET THEORY
- ELLIOTT WAVE THEORY
- ENVELOPES (TRADING BANDS)
- EQUIVOLUME
- FIBONACCI STUDIES
- FORECAST OSCILLATOR
- FOUR PERCENT MODEL
- FOURIER TRANSFORM
- FUNDAMENTAL ANALYSIS
- GANN ANGLES
- HERRICK PAYOFF INDEX
- INERTIA
- INTEREST RATES
- INTRADAY MOMENTUM INDEX
- KAGI
- KLINGER OSCILLATOR
- LARGE BLOCK RATIO
- LINEAR REGRESSION INDICATOR
- LINEAR REGRESSION SLOPE
- LINEAR REGRESSION TRENDLINES
- MARKET FACILITATION INDEX
- MASS INDEX
- McCLELLAN OSCILLATOR
- McCLELLAN SUMMATION INDEX
- MEDIAN PRICE
- MEMBER SHORT RATIO
- MESA SINE WAVE
- MOMENTUM
- MONEY FLOW INDEX
- MOVING AVERAGE CONVERGENCE/DIVERGENCE
- MOVING AVERAGES
- NEGATIVE VOLUME INDEX
- NEW HIGHS-LOWS CUMULATIVE
- NEW HIGHS/LOWS RATIO
- NEW HIGHS-NEW LOWS
- ODD LOT BALANCE INDEX
- PUBLIC SHORT RATIO
- PUTS/CALLS RATIO
- QSTICK
- QUADRANT LINES
- R-SQUARED
- RAFF REGRESSION CHANNEL
- RANDOM WALK INDEX
- RANGE INDICATOR
- RECTANGLE
- RELATIVE MOMENTUM INDEX
- RELATIVE STRENGTH, COMPARATIVE
- RELATIVE STRENGTH INDEX
- RELATIVE VOLATILITY INDEX
- RENKO
- SPEED RESISTANCE LINES
- SPREADS
- STANDARD DEVIATION
- STANDARD DEVIATION CHANNEL
- STANDARD ERROR
- STANDARD ERROR BANDS
- STANDARD ERROR CHANNEL
- STIX
- STOCHASTIC MOMENTUM INDEX
- STOCHASTIC OSCILLATOR
- SWING INDEX
- TEMA
- THREE LINE BREAK
- TIME SERIES FORECAST
- TIRONE LEVELS
- TOTAL SHORT RATIO
- TRADE VOLUME INDEX
- TRENDLINES
- TRIX
- TYPICAL PRICE
- ULTIMATE OSCILLATOR
- UPSIDE/DOWNSIDE RATIO
- UPSIDE/DOWNSIDE VOLUME
- VERTICAL HORIZONTAL FILTER
- VOLATILITY, CHAIKIN’S
- VOLUME
- VOLUME OSCILLATOR
- VOLUME RATE-OF-CHANGE
- WEIGHTED CLOSE
- WILDER’S SMOOTHING
- WILLIAMS’S ACCUMULATION/DISTRIBUTION
- WILLIAMS’S %R
- ZIG ZAG
Technical Analysis from A to Z By Steven B. Achelis

