Articles
The Three-line Break chart (TLB)
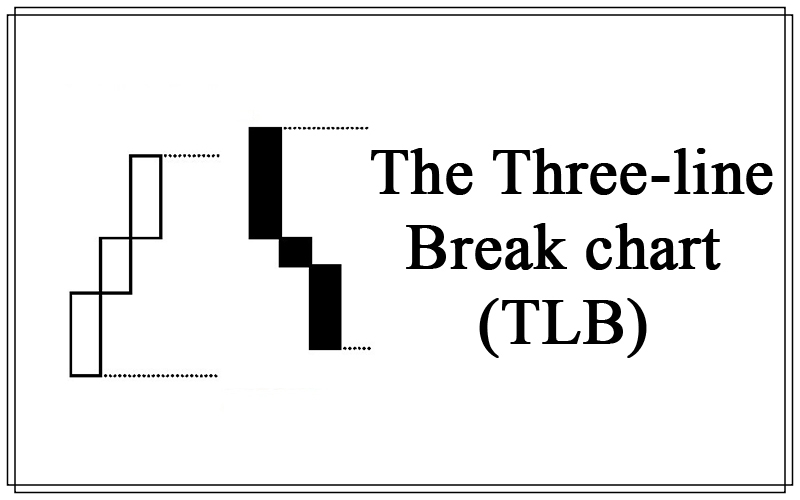
In use for the past 130 years in Japan, this chart style has a chance of becoming more and more common throughout the world lately because of the borderless Internet. The TLB charts display little of the congestion areas, no gaps and no volume of shares traded. They depict the direction of the market, they are trend followers and, because all the well-known rules of support/resistance, trend-lines, time frames, double or triple tops/bottoms, ascending/descending triangles, retracements, etc. apply, their message can easily be grasped.
Chart construction
The TLB charts are made according to specific principles.
- With no mark on the chart, having to start somewhere (Fig. 1), if the Close today is higher than the yesterday’s High, a new block (called a “line”) is drawn in white to the right (Fig. 2). If the Close today is lower than the yester-day’s Low, a new line is drawn in black to the right (Fig. 3). If the Close today is within the yesterday’s range, no line is drawn (Fig. 1). The yesterday’s High or Low must be exceeded, not just touched, for a new line to be drawn.

- Next, with one line on the chart (Fig. 4), if today’s Close is higher than that one line, a new white line is drawn to the right (Fig. 5); conversely, if the today’s Close is lower than that one line, a new black line is drawn to the right (Fig. 6). Be aware that many days can pass until the Close today is higher than the High or lower than the Low of that one line!

Again, if the Close today stays within the range of that one line, no new line is being drawn (Fig. 4). Many days can pass with all of their Closes within the range of that one line!
A) With two white lines now on the chart (Fig. 7), if the today’s Close is higher than the High of the last line, a new white line is drawn to the right (Fig. 8). Many days can pass before the Close today rises above the last line.
The price would have to go lower than the Low of the one before the last white line for a black line to be drawn (Fig. 5, dashed line).

B) With two black lines now on the chart, (Fig. 7), if the Close today is lower than the Low of the last line, a new black line is being drawn to the right (Fig. 9). It could take many days until this happens!
The price would have to go higher than the High of the one before the last black line for a white line to be drawn (Fig. 6, dashed line).
Obviously, if the Close today is within the range of the last two lines, either white or black, no new line is being drawn (Fig. 7). Many days will pass with all of their Closes staying within the range of the last two lines!
- With three lines of the same color in a row on the chart now (Fig. 8, 9 and 10), a trend is underway. From now on, new lines are drawn according to the rules at A. and B. above.
A reversal down is drawn only when the Close today is lower than the lowest Low of the last three white lines (Fig. 11, dashed line). A reversal up is shown only when the Close today is higher than the highest High of the last three black lines (Fig. 12, dashed line).

This is why the method is called the “Three-line Break”.
A line reversing the trend is called a white or black turning line.
Something to remember when system-testing the TLB technique!
It takes many days or many weeks for the price to exceed the previous three same color lines for a turning line to be drawn on the chart. During that period, the price may advance, decline and congest several times before exceeding the length of the prior three same color lines. One distinct advantage of the TLB charts is that there is no preset reversal amount (like in the Point & Figure ones). The market’s action is the one that gives the extent of a reversal.
To sum up, while a new line is penciled in only if the Close today exceeds the last line, either up or down, a turning line is drawn only when the Close today moves under or above the last three same color lines. This implies that the price has to move in the opposite direction of the last line for a reversal to show up on the chart. This is what makes the TLB method a trend follower and absolutely not a top or bottom detector. The anguish found at the market tops and bottoms is unknown to the TLB investor.
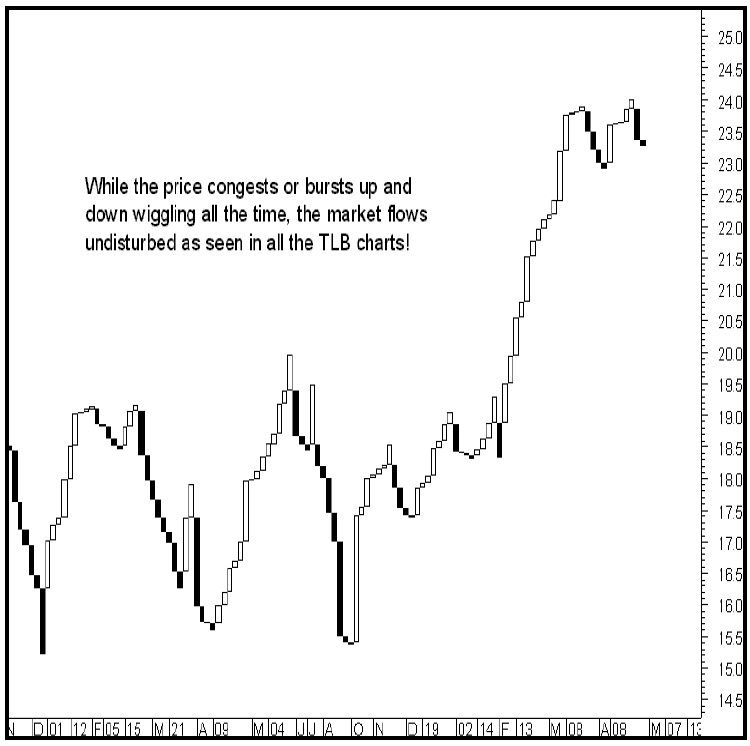
Fig. 13 The TLB is about smooth market flow!
TLB patterns
The Japanese had a way of giving names to the chart formations. For instance, a downtrend-reversing pattern consisting of a short black line, followed by a longer white line and ending with a new short white line is being called “the Black Shoe, White Suit and a Neck” because it looks like somebody dressed in white wearing black shoes! An up-trend-reversing pattern is called “the Neck, Black Suit and Black Shoe” (the Neck is a short white line, the Black Suit is a black relatively long line and the Black Shoe is a short black line).
A “Sweater and Pants” occurs when the turning line breaks above or below the previous four lines or when a series of large range lines show up in a trend. The message is that, although the new trend might continue, the continuation will be in small increments and that what was important, has already been consumed! “Hats” occur at market tops when the lines are very short; they uncover the Bulls’ inability of sending the prices higher.
A string of eight lines or more of the same color is considered an overbought or oversold situation, as the case may be. There are securities that display mostly the 8-line phenomenon repeatedly within a particular time span, and there are others that display multiple trends made out of only small number lines. (Perhaps the speculators trading them are generally the same ones during that time period). Knowing this helps with knowing what to expect!
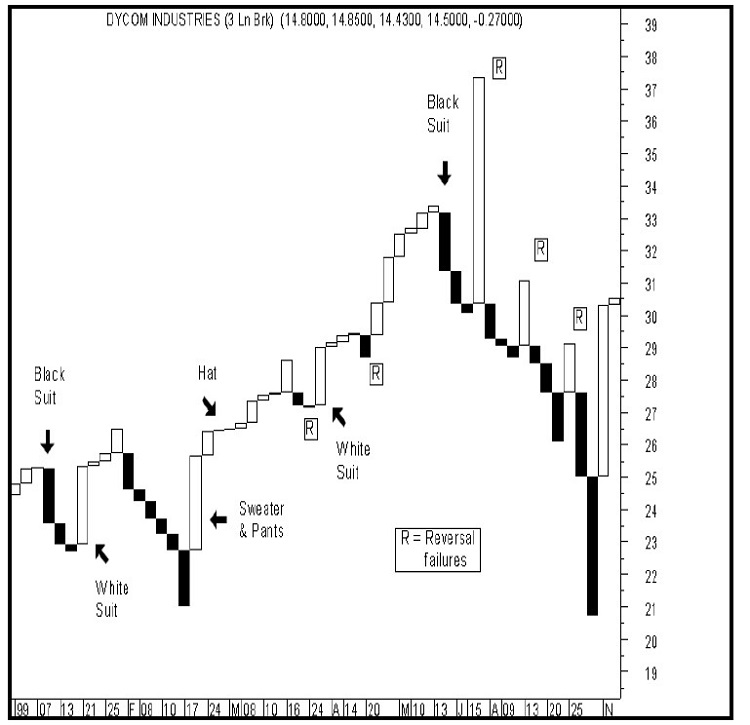
Fig. 14 – Typical TLB chart formations
How to trade TLB?
Books upon books on this subject have been written in Japan. Here are some ideas:
1. The basic concept is to buy on the completion of a white line and to sell on the completion of a black one. Buying or selling well after the market turned is the preferred choice of those speculators who give up the uncertainty of picking the market tops and bottoms for the safety of taking action somewhere along the trend.
The TLB charts reveal very few whipsaws in a year. When a speculator is being caught in one, the right approach is to place a Stop-and-Reverse order. One clue is to look for the security that just exited a whipsaw. Chances are another one will not happen right away!
2. One way of buying or shorting sooner is to enter the market during an intra-day reversal signal, with a small order. When the turning line confirms the reversal (by exceeding the preceding three same-color lines), a new order for more units can be placed. If the reversal takes “too long” to unfold or fails to occur altogether, the initial small order is quickly liquidated (hopefully before the breakeven point is reached).
3. A variation to the approach above (2.) is to place a Buy Stop order at the level where the highest of last three black lines is and exit when the price turns down close to the bottom of the last white line. For shorting, a Sell Stop order is placed at the level where the lowest Low of the last three white lines is and covering when the price turns up close to the High of the last black line.
4. Conservative speculators can enter the market at the second line, either white or black, and will exit when a trailing stop is hit.
5. Action in the market is to be taken when the entry signals are being triggered but the exits are to be considered:
- when a profit target is being arrived at or,
- on a trend-line violation, making it unnecessary to wait for a real exit signal to be flagged or,
- when the market fails to move according to expectations.
The TLB method can be compared to trading longer-term moving averages but without their whipsaws drama! … It pays to keep an eye on Bullish advances on the Close-only chart (not yet shown on the TLB chart!) while the market is in a downtrend on the TLB chart and conversely, for Bearish declines on the Close-only chart – also before they appear on the TLB chart – when the market is trending up on the TLB chart!
The height of the lines can and do give clues about the market strength and dynamism: is it a short time/short line, a short time/long line, a long time/short line or a long time/long line that the price is passing through? Has the last line entered or left a support zone? Is the resistance nearby or far away? Has the last line moved within a trading range? Is the trading range narrow or wide? Is the last line that touched the former support a long or a short one? Did it take a day or two for the last line to form or did it take several days? How about the former resistance, is it materializing? Is there an intersection between the shorter time frame and the larger one taking place right now? Is the turning line far exceeding the previous three same color lines or is it barely making it through?
Questions like these are what the TLB charts bring about. Noteworthy is the fact that, one or two lines – when found alone – more often than not, point to additional price movement in the direction prior to their occurrence. It is the classical follow-through failure that confirms the continuation of the trend: the interruptions occur when both market entries and position liquidations are light, in insufficient quantity to reverse the market direction.
Modified TLB charts
The Japanese experimented with the number of lines required for a reversal to occur. On changing the line break from the standard of three down to two or one, more minute market movements are recorded but more probabilities for the speculator to get whipsawed are created. On the other hand, changing the line break from the standard of three up to four lines or more, fewer reversals will show up and more time span will be on display.All the principles and patterns operating in the typical three-line break chart will work well with the smaller or larger number of lines employed but at different risk/reward ratios.
Every tradable financial instrument, including mutual funds and bond yields that use only the Close (no High and no Low values) can be charted and traded using the TLB methodology. The TLB is both a charting style and a trading system in itself. It with-stood the test of time and it embodied the thinking found in the modern-days trend following systems. Indicators (moving averages, RSI, ADX, ROC, Stochastic, etc.) can be plotted easily in MetaStock and other technical analysis software programs but why bother?
The TLB occasionally requires the trader to think uncommonly: enter the market where turning points rather than a trend continuation take shape, watch it go in the opposite direction of what has been anticipated and hold positions) through an adverse – sometimes lengthy – move until the price reaches and surpasses the entry value! All this for a remote (few) dollars gain! A comparison between the TLB and the bar charts will reveal this phenomenon, a profitable one however! It is in situations like these that the short-term focus on price dissipates into a longer-term expectation on what the markets have to offer!
Summary
While the Japanese Candlestick charts have been fully integrated into the Western financial speculations of the last decade, the TLB hasn’t. A possible cause for this is the fact that the candlesticks can be utilized on any trading time frame, from the shortest one to the longest, whereas the TLB seems to be more useful to the intermediate-term and long-term investor. Another possible cause is the fact that the TLB incorporates elements of contrarian thinking, something that makes it somewhat harder to grasp and execute than the more popular straight-forward approaches available in this day and age.
The TLB’s purpose now is to remind us that if we are to be successful in the markets, training ourselves to trade for the fast results of the short term can be done without ignoring the long-term potential! …

