Articles
Ram Trading

With this simple daytrading method using candlestick formations and the opening action, this author demonstrates a high-probability, low-risk trading strategy that gets you in and out in a single day. Just as the battering ram had a single purpose in the earliest wars —namely, punching a hole in a barred city gate — what I refer to as the Ram trading method is focused on a singular goal: to identify and implement low-risk trades that make money. To a trader, time is all-important. For stock traders, the shorter the time interval between buys and sells, the less likely it is that something will go wrong. Ram trading minimizes this risk by concentrating on the shortest of trading time units — a fraction of a trading day. For consistency’s sake, the terminology in this analysis assumes that “right now” is just prior to today’s opening of trade.
STOCKPICKING
Candlestick analysis is one technique that concentrates on short-term price movement. It is an excellent method for determining today’s likely price trend. There is extensive literature about candlesticks, and there are software packages to do the charting. Candlesticks are simple to use, and all a trader needs are three or so days of prior price action to produce proper results.
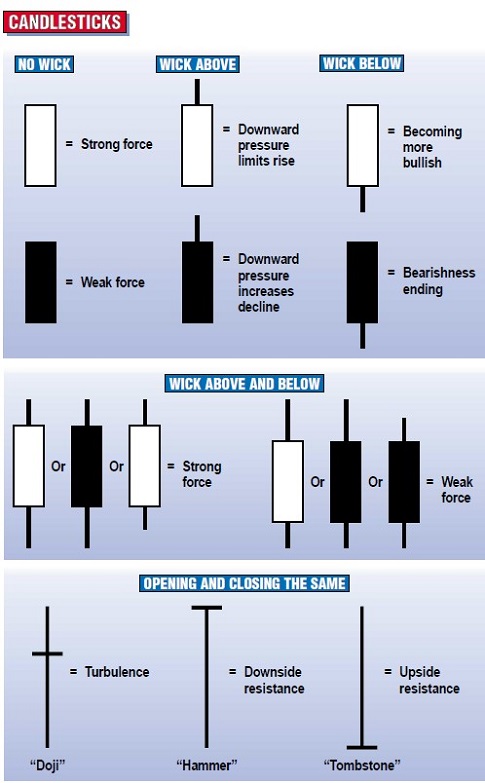
Candlestick analysis utilizes a stock’s open, high, low, and close to produce a chart of daily price movement to indicate current market psychology. The body of the candlestick represents the price movement between the open and close, and the wicks, if any, depict the intraday price extremes. A white candle represents a stock that rises, while a black candle represents a stock that declines. When the opening and closing prices are the same, there is no candle at all. These charting characteristics result in a number of candlestick pictures, each of which depicts a different psychology. The more common ones can be seen in Figure 1.
- FIGURE 1: INDIVIDUAL CANDLESTICKS. Candlesticks can convey a range of psycho-logical conditions.
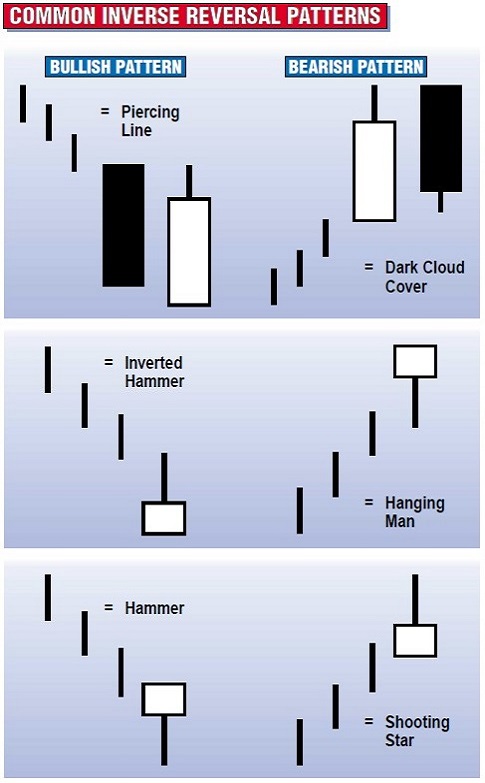
- FIGURE 2: INVERSE CANDLESTICK PATTERNS. For most candle-sticks, there are two patterns: one bullish and the other bearish.
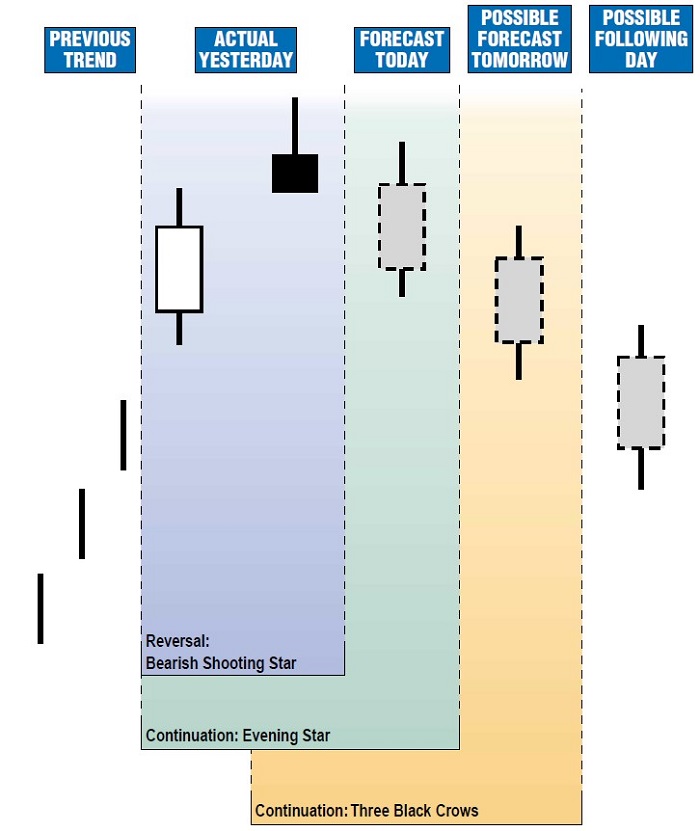
When two or more candlesticks are combined, they produce patterns that fall into two categories: those that are used to predict turning points and those that predict a continuing price trend. Typically, when there is a bullish pattern, there is also an inverse bearish pattern, as can be seen in Figure 2. Patterns are determined from yesterday’s price action and not only identify today’s likely price trend, but in some cases, tomorrow’s price as well.
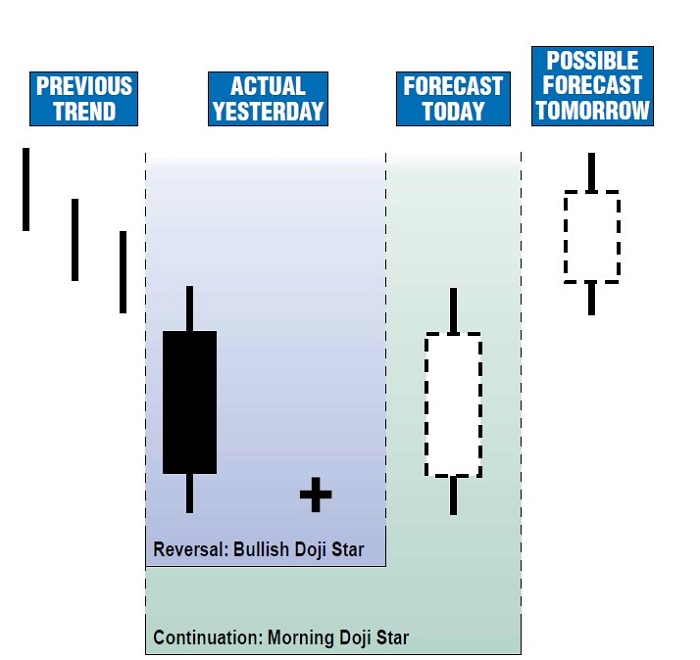
- FIGURE 3: DOJI PATTERN. A doji, which is a candle with little or no body, indicates that if there is a trend it is likely to change. Shown is the bullish version.
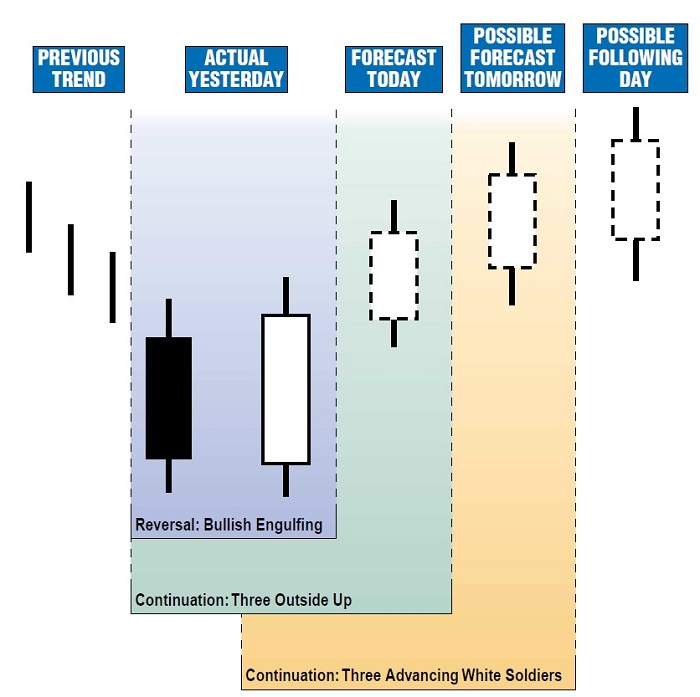
- FIGURE 4: ENGULFING PATTERN. The engulfing pattern consists of two opposite candles, with the second engulfing the first. The pattern indicates that a shift in trend is likely. The new trend may last as long as three days, but two days seem to be long enough for traders to pay attention to it. In any case, such trends seldom seem to last longer than three days. Shown is the bullish version.
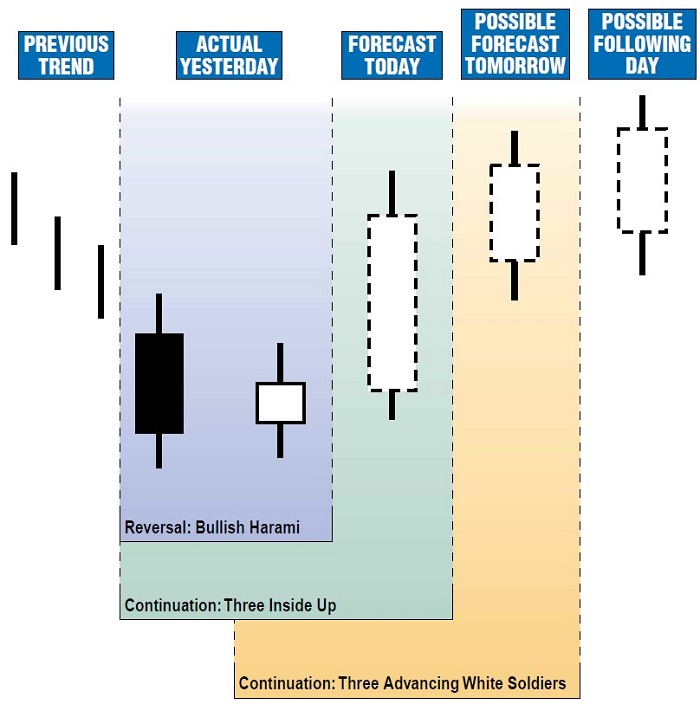
To illustrate the selection procedure, charts using both reversal and continuation candlesticks can be seen in Figures 3 through 6. Each begins with a reversal pattern and shows that if it comes about as predicted, then a single stock may be traded for two or three consecutive days by using continuation patterns. As a trader becomes more familiar with this technique, he can utilize a greater number of candlestick patterns. The objective of screening stocks for candlestick patterns is to identify from a universe of 30 or so a maximum of two stocks to trade each day, and to determine in advance what their likely price trend will be. Armed with this information from yesterday’s price action, we are now ready to begin today’s trading process.
- FIGURE 5: HARAMI PATTERN. The harami pattern consists of a small body (or a doji) contained within a prior, opposing body. The pattern indicates a change in trend is likely and it, too, may last as long as three days. Shown is the bullish version.
TO TRADE OR NOT TO TRADE
The next step to successful trading is to determine whether the price trend of the stock is indeed moving in the predicted direction. This can be established within the 15 to 30 minutes following the opening bell, and it has two components — the stock and the market. The components are simple and easy to measure. First, either the stock moves after the open in the predicted direction (that is, it confirms) or it doesn’t. Second, either the market as a whole (measured by a popular index that includes the target stock) moves in the desired direction or it doesn’t— that is, it trends in the opposite direction. So I have to look for any of four possible conditions:
- Both the stock and the market confirm in the desired direction.
- The stock confirms, but the market does not.
- The market confirms, but the stock does not.
- Both the stock and the market move opposite to the desired direction.
By trial and error, I have concluded that the simple and easy way to use the Ram trading method is to identify one or two daily trading opportunities that result in profits about seven times out of 10.
Now I have the information to move on to the third step, which is to either take a position or sit on the sidelines. Here are the Ram trading conditions:
- If the stock confirms by moving as predicted from the open and the market moves in the forecast direction, take a position in the stock, regardless of price.
- If the stock confirms and the market moves opposite of the forecast direction, take a position in the stock only if it is near the previous day’s closing price and the stock starts to trend in the predicted direction within 30 minutes of the open.
- If the stock does not move in the forecast direction but the market does, take a position in the stock only if the stock starts to trend in the predicted direction within 30 minutes of the open.
- If the stock and the market move opposite to the predicted direction, do not take a position in the stock, even if the trend reverses later in the trading session.
STOPS
The fourth and most important trading step is to determine when to close out a position. My overriding concern is that I do not want to carry a position into tomorrow; too many things can happen overnight to jeopardize my capital. For example, earnings and major corporate announcements are usually made after trading has ceased for the day. Similarly, economic news that can be either positive or negative for the market is released typically prior to the next day’s opening. Let me reemphasize: To a trader, time is risk, so keep a short time horizon.
I use stops to capture trading gains and minimize trading losses. I place tight stops — typically 25 cents away from opening positions — and my stops are adjusted every time the stock moves 25 cents in the desired direction. This typically ensures that profits are locked in and potential losses that may develop late in the day are kept within acceptable limits. My experience has been that most positions are closed out automatically via a stop. Once a stop is triggered, that stock is ignored until tomorrow.
There are times, however, when fortune smiles and a stock continues to move in the direction I want it to. In these cases, all my positions are closed out, regardless of price, at least 30 minutes prior to the day’s close. Sideways moving positions are also closed out at that time. Positions can be closed out earlier if the market suddenly reverses direction, or if I am happy with current profits.
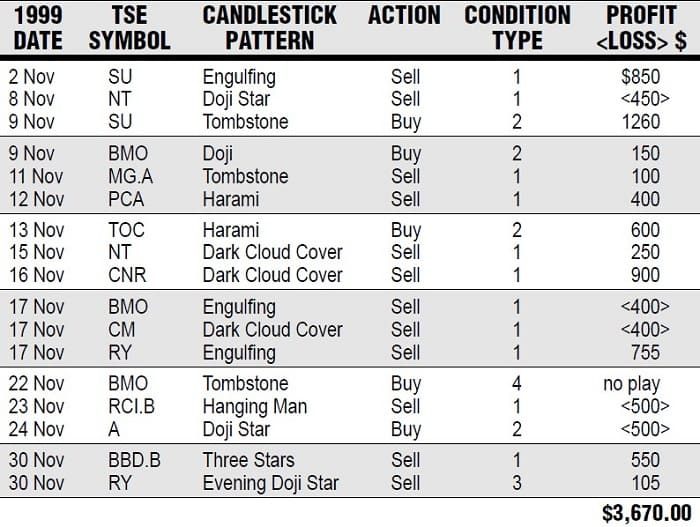
FIGURE 7: RAM TRADING ON THE TORONTO STOCK EXCHANGE. In November 1999, there were 17 picks, of which 11 were winners, five were losers, and one was not played, resulting in a profit of $3,670.
CONCLUSION
By trial and error, I have concluded that the simple and easy way to use the Ram trading method is to identify one or two daily trading opportunities that result in profits about seven times out of 10. By keeping tight stop positions, the inevitable, occasional loss is held to a minimum, and over time, the gains accumulate.
How much profit accumulates depends not only upon using Ram analysis successfully but also on the size of each position taken. I started small and now I’m comfortable with 2,000-share positions. Figure 7 shows a trading summary for November 1999, and it illustrates how Ram trading can generate profits from price action on the Toronto Stock Exchange. Check the action in these stocks to see how my approach works.

