Articles
Candlestick Filtering

Using candlestick patterns alone to generate buy and sell signals may be risky. Combining them with confirming indicators can greatly increase reliability. Take a look. Few candlestick patterns can stand alone without confirmation of some kind. It is extremely risky to trust buy and sell signals based solely on these patterns. You can diminish some of the uncertainty, though, by filtering the candlesticks’ signals, using other indicators to confirm buy or sell signals.
In the case of candlesticks, the question arises: What to use for confirmation? For an answer, consider this: candlestick patterns are merely a differ-ent form of chart pattern. Candlesticks and standard price bars display exactly the same information — open, high, low, and close. Therefore, any indicators you are currently using on bar charts can be used to confirm the candlestick pattern. This is the essence of my filtering process. Momentum and the relative strength indicator (RSI) make good companion confirmation indicators to candlesticks. All that is necessary is to select indicator parameters that support and confirm each other and also filter the candlesticks. Backtesting helps finetune the parameters.
COMBINATIONS
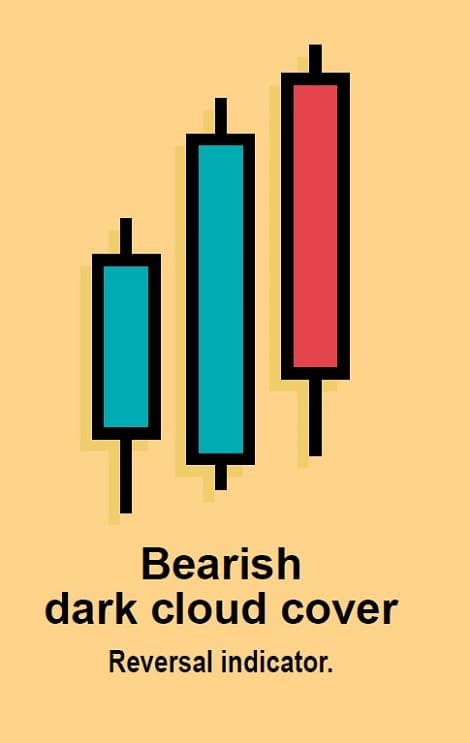
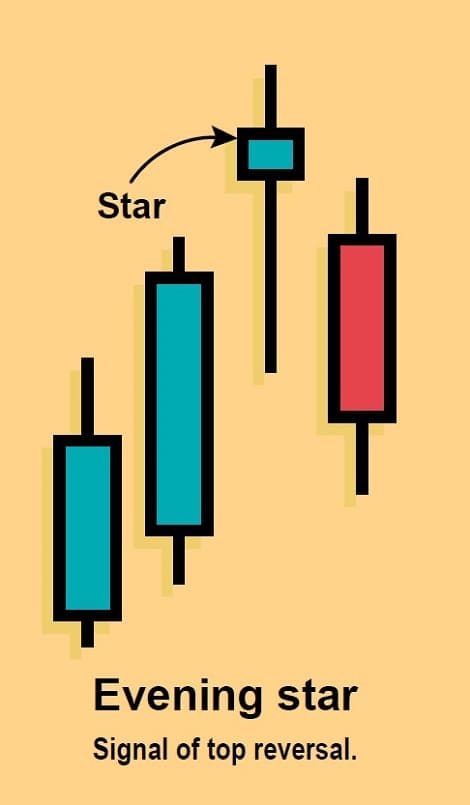
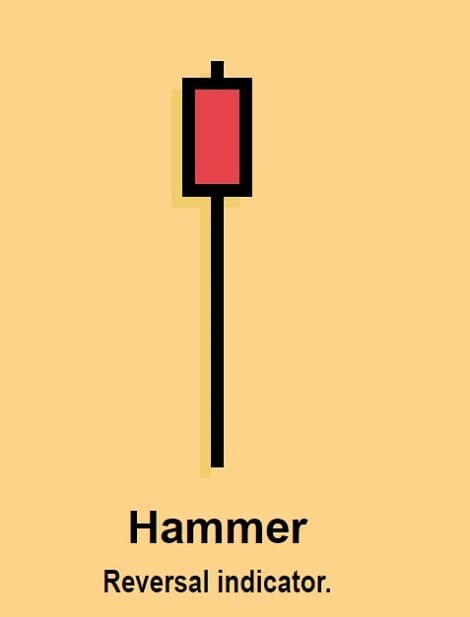
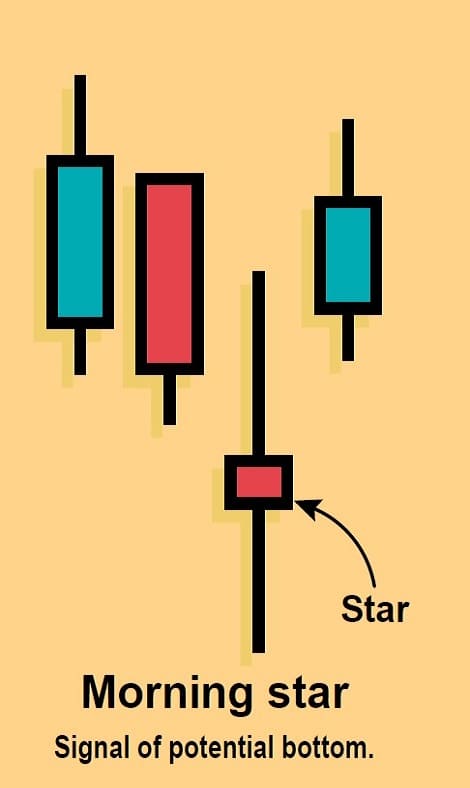
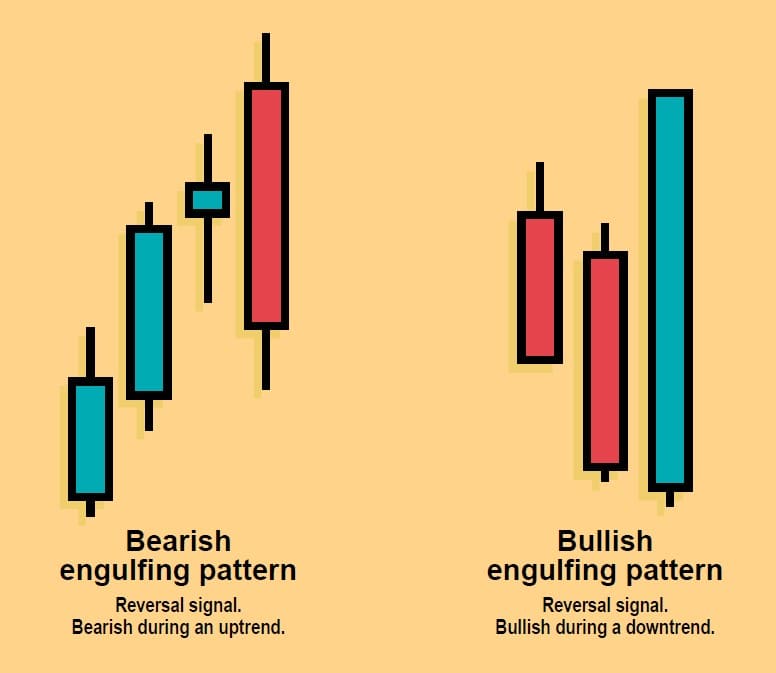
There are approximately 65 candlestick patterns and more than a dozen indicators that could be used for confirmation, so there could be hundreds of possible combinations. I used three bullish patterns (bullish engulfing, morning star, and hammer) and three bearish patterns (bearish engulfing pattern, evening star, and dark cloud cover). Some candlestick chartists maintain that the morning star and dark cloud cover patterns require no confirmation, but until my own backtesting verifies this, I’ll continue to use confirmation indicators.
I developed a trading system in two parts: a setup and an entry. The setup is a combination of conditions that must be met to set the stage for a possible entry into the market. This initiates the “ready-aim” mode. The entry is the set of conditions that must exist to actually execute a trade. This is the “fire” mode. Here is the plain-language formula for a long entry system:
Setup: If a bullish engulfing pattern or a morning star or a hammer appears and momentum is greater than zero, and RSI is greater than 50 and less than 70, then:
Entry: Buy the next bar at today’s high, plus $1.00 stop.
The parameters are just starting points for testing a system. When J. Welles Wilder developed the RSI, he defined 30 and 70 as the oversold and overbought thresh-olds, respectively; many users suggest 20 and 80. If you decided to make the system less restrictive to produce more buy signals, you might try changing 50 to 30 and/or changing 70 to 80. This would, in effect, open the filter window a little wider. You could also add one or two more indicators, such as moving average convergence/divergence (MACD), stochastics, money flow, or average directional index (ADX). Of course, it is also possible that having too many indicators may present situations in which the four indicators never confirm each other, thereby producing no buy signals.
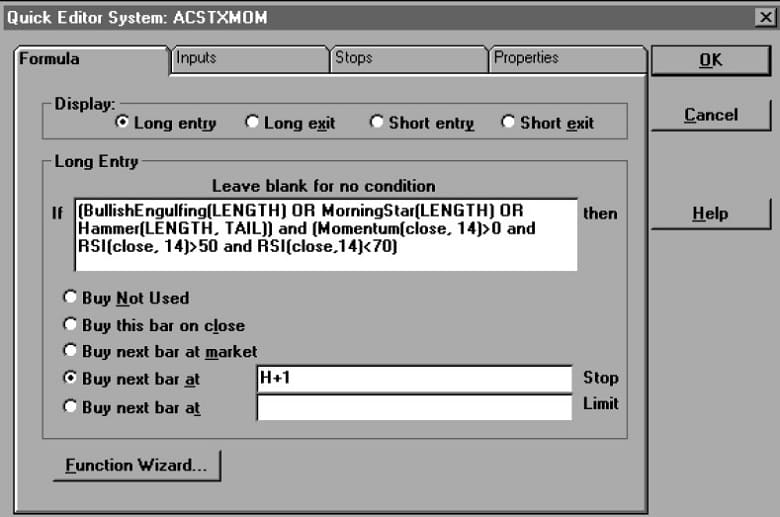
- FIGURE 1: GOING LONG. Rules for going long from a combination of bullish candlestick formations and rising RSI are spelled out in a SuperCharts system. Substituting other indicators for RSI or momentum is worth exploring.
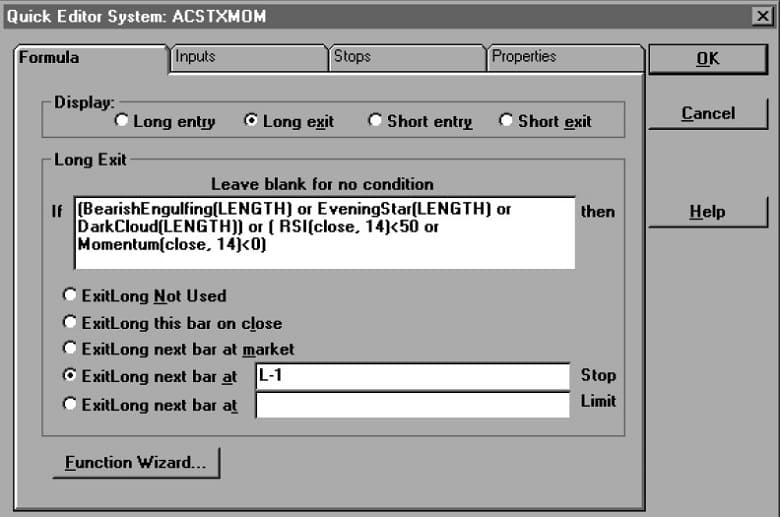
- FIGURE 2: GETTING OUT. Exit rules for your trade can also be specified in terms of candlestick formations and indicators.
Figure 1 is a look at the formula in SuperCharts’ EasyLanguage. Following the logic of the plain language formula, it should only be necessary to use the correct syntax to write this formula in any other program. The length may be any lookback you wish, but the default in candlesticks is five bars. The momentum and RSI parameters are the filters. If those parameters are satisfied, they enable any of the candlestick patterns that appear.
If the setup is satisfied, I take the long entry if and only if the next day’s price range hit a price$1.00 higher than today’s high. This is an extra bullish requirement so that we don’t enter the market if the next day is a down day. (If you are playing the other side of the market, these long entries and exits may also be used for short exits and entries, respectively.)
Figure 2 is the long exit formula in SuperCharts’ QuickEditor. I was somewhat conservative and exited on any negative occurrence, but only if the next day’s price range hit a price $1.00 lower than today’s low. Again, this is a precaution against selling if the next day is an up day. Of course, the buy/sell stops can be any that you wish, or they can be left out entirely.
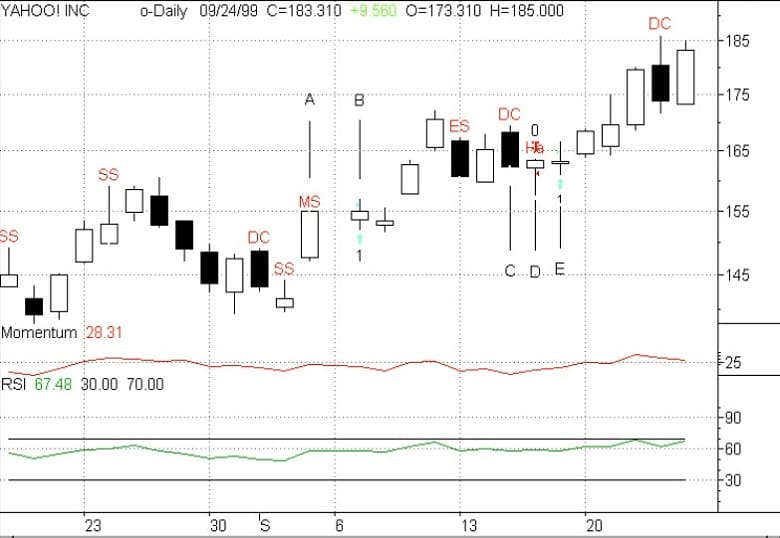
Figure 3 is a screen shot of Yahoo! with some of the results. At point A, we see a morning star pattern. Momentum was 20 and RSI was 50, so our setup was satisfied for a long entry. The next day, the price exceeded the previous day’s high by $1.00, so a buy signal was generated, as shown by point B. At points C, D, and E, we had an unusual situation, but one that proved that computers — and trading systems —do what they’re told to do, with no second-guessing. At C, we see a dark cloud cover. This is all we needed to complete the setup for a long exit.
The next day, the price fell below the previous day’s low by$1.00, so an exit signal was generated at point D. However, this day also generated a hammer, and since momentum was above zero and RSI was between 50 and 70, we also satisfied the setup for a long entry. The next day, the price exceeded the previous day’s high by $1.00 and we got another buy signal, getting thoroughly whipsawed in the process.
- FIGURE 3: YAHOO! Yahoo! rises in late 1998, and a combination of candlesticks, momentum, and RSI ride it profitably. Since candlesticks use the same information that indicators do, you can confirm one with the other.
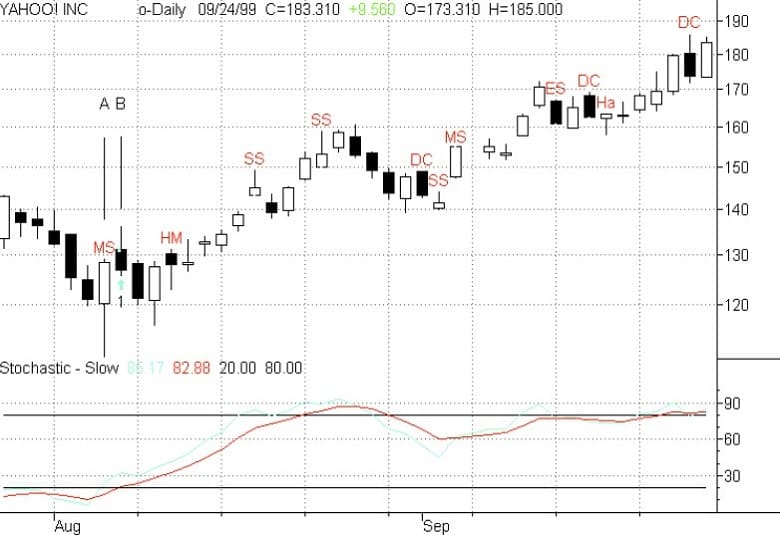
- FIGURE 4: STOCHASTICS AND CANDLESTICKS. Here’s slow %K crossing up with a morning star formation, at a confirmed going long in Yahoo!
Figure 4 shows a chart using a stochastics system. The setup here requires one of the bullish candlestick patterns with slow %D below 20 and slow %K crossing above slow%D. This occurred with a morning star pattern at point A in Figure 4, completing the setup. The next day, even though we had a black body, the price exceeded the previous day’s price by $1.00 so a buy signal was generated, as can be seen by the up arrow at point B. A long exit would require one of the three bearish candlestick patterns, with slow %D above 80 and slow %K crossing below slow %D. This had not occurred as of September 24, 1999, the date of this chart.
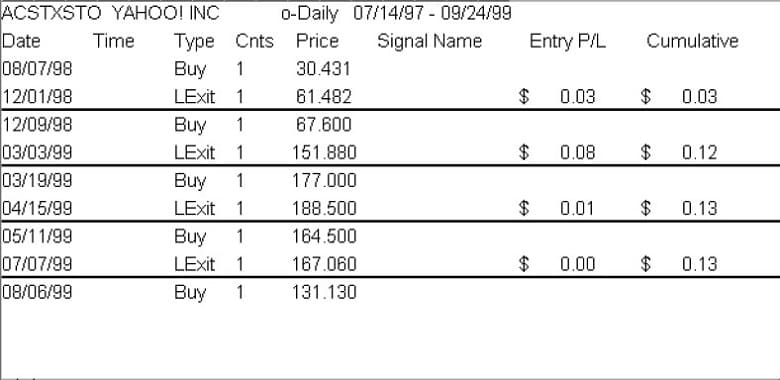
FIGURE 5: RESULTS. Though it trades infrequently, the last year of the stochastic and candlestick confirmation approach has yielded winners.
Figure 5 shows a trade-by-trade summary for the past year. We had four entries and exits, all profitable, and we are currently long following the entry at point A in Figure 4. Not every set of trades will work this well, but the experience suggests that entries, at least, can be improved by combining other indicators with candlesticks. Almost any indicator can be used as a filter, limited only by your imagination and your software. These combinations reduce the reliance on using only candlesticks and will give you a better confirmation of your entry and exit signals.

