Articles
How to Identify Key Support and Resistance Levels
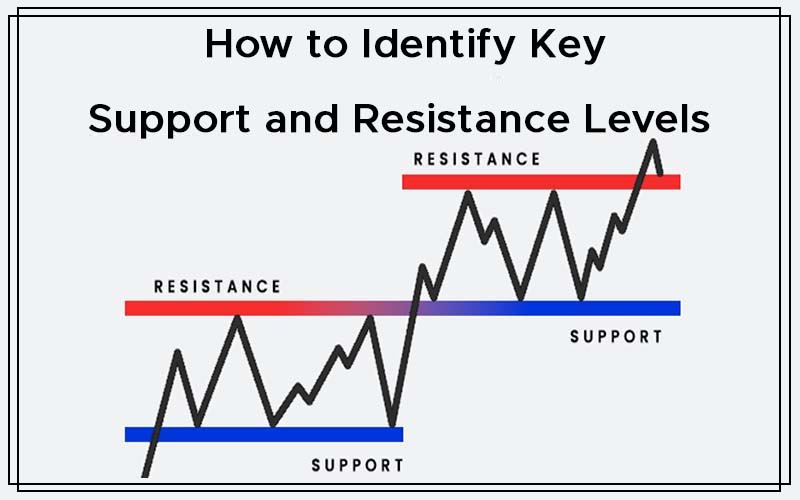
Key Support and Resistance levels are simply regions where the prices on the chart have found it difficult to fall below or above, and often rejected any attacks to break those levels. Because of these reactions, they refer to key areas on the chart where institutional traders are likely to buy or sell their instrument, take profit, or place their stop around.
Support and resistance levels can be formed in three ways:
a) Psychological support/resistance
b) Pivot support/resistance
c) Price action support/resistance
Psychological support/resistance occurs as a result of traders using price levels that end in round figures (such as 00, as in 1.5500, 1.6000, 128.00, etc.) as areas where they set their price targets.
If buyers of an instrument us any of these round figures as price targets, that area will form a psychological resistance. In the same vein, if sellers use round figures as their trade exit targets, those areas will automatically become psychological supports.
Pivot support/resistance points are calculated by the application of pivot points which have been used by floor traders and professionals for decades.
Pivot points are calculated from the previous day’s high, low and closing prices. Using pivot points, there are three levels of support (S1, S2 and S3), a central pivot point, and three lines of resistance (R1, R2 and R3).
However, the price action of the instrument will ultimately determine how each of these lines react, as it is possible for a support to act as a resistance when broken, or for a resistance to act as a support when breached.
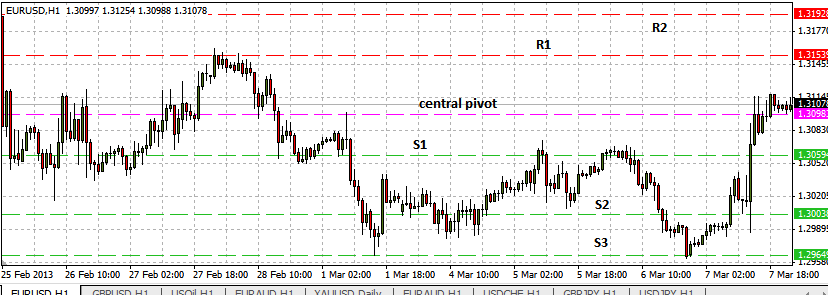
This chart above shows the pivot points as plotted by a pivot point calculator.
Price action can also determine where support and resistance occur. If a particular price level has functioned as a support or resistance level in the recent past, it is likely that traders will respect those levels when prices approach them, as the sentiment at the time may indicate a recent support as an oversold area, or a recent resistance as an overbought area.
Using the chart above, you can clearly see how price action reacted to the S3, S2 and S1 pivots finding a double bottom at the S3, and resistance 2x at the S1 pivot.
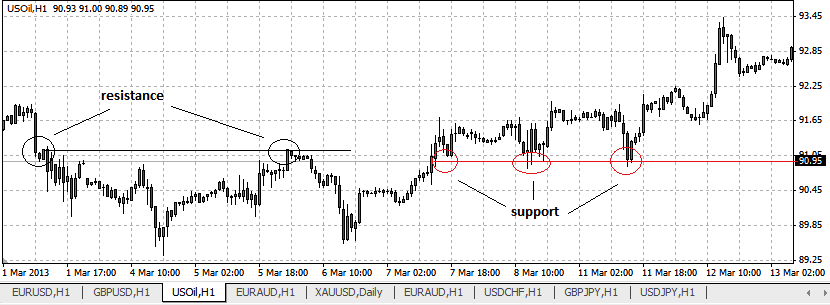
Fig0a: Price action forming support and resistance areas
The chart above shows areas that price action formed support and resistance levels. We can also see that the region that used to be the resistance area eventually became a support area when it was broken. Incidentally, this was also at a psychological area of 91.00 to 91.10, where the price of the asset formed a round figure.
Since support and resistance levels define areas where buyers and sellers of an asset enter and exit trade positions, they are important when determining entry and exit points based on support/resistance trade strategies.
How To identify Support and Resistance Levels
Given the description of support and resistance from above, it is very easy to identify support and resistance areas on the chart. Support and resistance are not defined by single price levels all the time, but sometimes as regions or zones that could be a few to several pips wide. They are formed by a very narrow range of prices as not every trader will exit or enter the market at the same point. Such ranges could be up to 10-15 pips.
a) Identifying Psychological Support/Resistance Areas
This is very easy. The trader looks for areas where the price of the asset ends in round figures, and then checks to see if this area has been respected as a support or resistance in the recent past. We can see this from Fig.0a above.
b) Pivot points
Rather than go through the complex pathway of trying to calculate pivot points using the previous day’s high, low and closing prices, a trader can use any of the pivot point tools on the internet, attach it to the charts and the lines of support, resistance as well as the pivot points will be drawn on the charts automatically. This is depicted below:
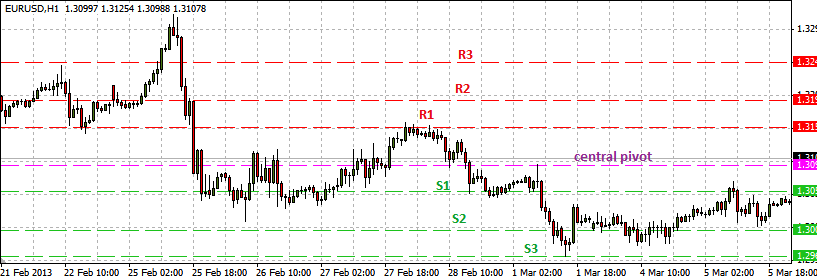
Fig1a: Support and resistance plotted with pivot point calculator
A broken pivot point changes role. For instance, if a down-trending price run breaks below the S2 support and tries to reach again for S2, S2 in this case no longer functions as a support but as a resistance. See chart below:
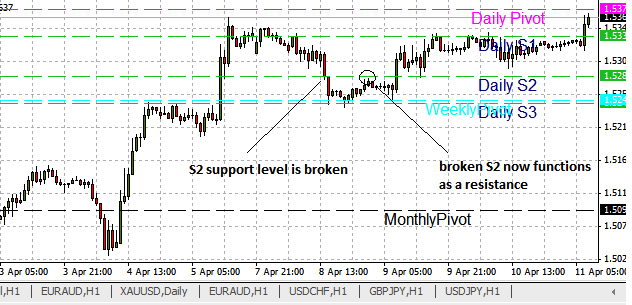
Fig1b: Break of pivot points and implication for support and resistance
c) Price action support/resistance
Another quick way to identify support and resistance levels is to scan the chartsto see areas where prices have formed recent support/resistance levels. If a bullish run terminates at a price level (say 1.2450), and retreats before assuming another bullish run that terminates at the same price of 1.2450, then 1.2450 is a resistance level. As long as that level holds, it serves as a resistance and once it is broken, it becomes a support.
How To Use Support and Resistance Zones When Trading
Support and resistance are basically areas of potential reversal. They are therefore suited for trading setups where there is potential for reversal, such as when they are traded with reversal candlestick patterns. The following candlestick patterns can be used to trade support and resistance reversals:
a) Pin Bars
There are others, but these are the easiest patterns that can be used.
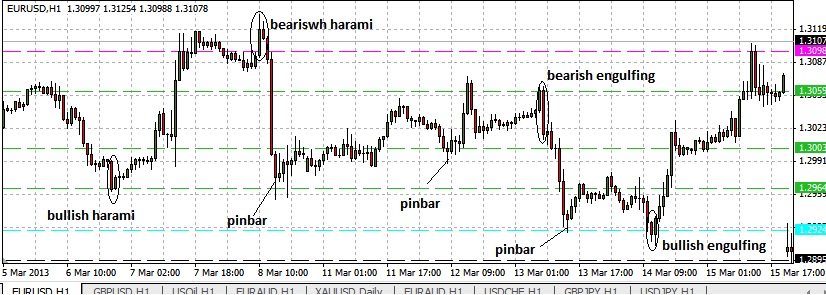
The chart above shows the various candlestick patterns that created reversals at various points of support and resistance.
Thus, when trading various price action patterns, and looking for optimal entries, always be looking for key support and resistance levels, as they generally mark key turning points in a pair or instrument. They also generally represent areas where institutional traders are placing orders, which helps with the defense of your trade working out.


